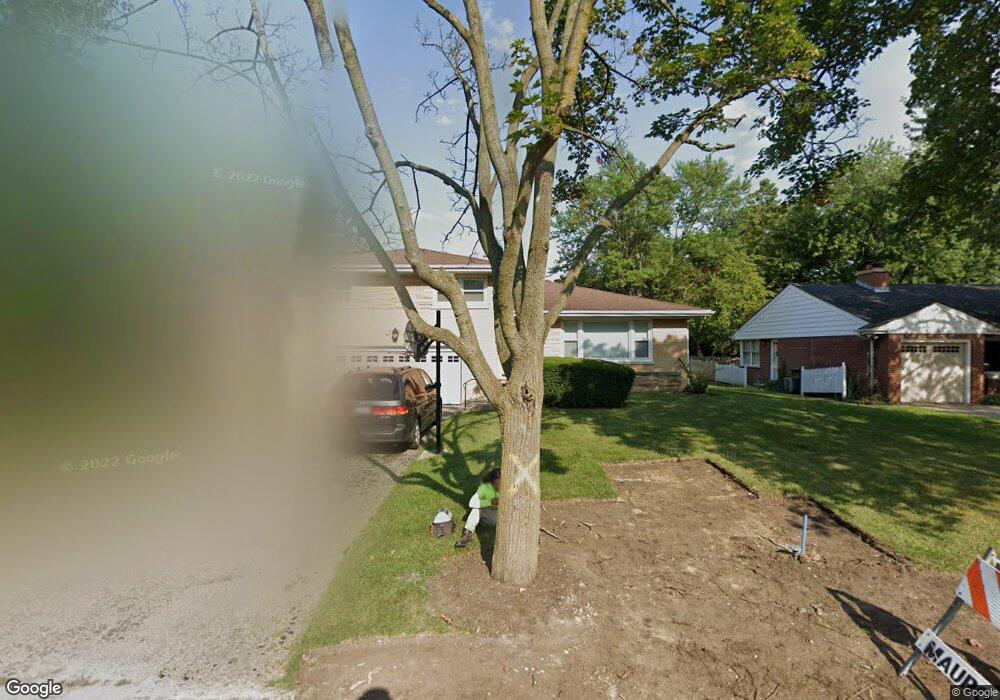
1329 Tinker Way Glenview, IL 60025
Estimated Value: $843,000 - $992,000
4
Beds
3
Baths
2,627
Sq Ft
$353/Sq Ft
Est. Value
About This Home
This home is located at 1329 Tinker Way, Glenview, IL 60025 and is currently estimated at $926,138, approximately $352 per square foot. 1329 Tinker Way is a home located in Cook County with nearby schools including Lyon Elementary School, Pleasant Ridge Elementary School, and Springman Middle School.
Ownership History
Date
Name
Owned For
Owner Type
Purchase Details
Closed on
Feb 25, 2009
Sold by
Everson Jonathan B
Bought by
Everson Jonathan B and Jonathan B Everson Trust
Current Estimated Value
Purchase Details
Closed on
May 24, 2000
Sold by
Fischer James D and Fischer Margaret M
Bought by
Everson Jonathan B and Everson Sheri L
Home Financials for this Owner
Home Financials are based on the most recent Mortgage that was taken out on this home.
Original Mortgage
$252,700
Outstanding Balance
$83,414
Interest Rate
8.14%
Estimated Equity
$842,724
Purchase Details
Closed on
Dec 3, 1996
Sold by
Altern Altern Alf H Alf H and Altern Smith Norma
Bought by
Fischer James D and Fischer Margaret M
Home Financials for this Owner
Home Financials are based on the most recent Mortgage that was taken out on this home.
Original Mortgage
$120,000
Interest Rate
7.85%
Create a Home Valuation Report for This Property
The Home Valuation Report is an in-depth analysis detailing your home's value as well as a comparison with similar homes in the area
Home Values in the Area
Average Home Value in this Area
Purchase History
| Date | Buyer | Sale Price | Title Company |
|---|---|---|---|
| Everson Jonathan B | -- | None Available | |
| Everson Jonathan B | $365,000 | -- | |
| Fischer James D | -- | -- | |
| Fischer James D | $262,000 | -- |
Source: Public Records
Mortgage History
| Date | Status | Borrower | Loan Amount |
|---|---|---|---|
| Open | Everson Jonathan B | $252,700 | |
| Previous Owner | Fischer James D | $120,000 | |
| Closed | Everson Jonathan B | $75,800 |
Source: Public Records
Tax History
| Year | Tax Paid | Tax Assessment Tax Assessment Total Assessment is a certain percentage of the fair market value that is determined by local assessors to be the total taxable value of land and additions on the property. | Land | Improvement |
|---|---|---|---|---|
| 2025 | $14,981 | $81,000 | $21,280 | $59,720 |
| 2024 | $14,981 | $71,000 | $17,920 | $53,080 |
| 2023 | $14,536 | $71,000 | $17,920 | $53,080 |
| 2022 | $14,536 | $71,000 | $17,920 | $53,080 |
| 2021 | $14,042 | $59,749 | $14,560 | $45,189 |
| 2020 | $13,932 | $59,749 | $14,560 | $45,189 |
| 2019 | $12,980 | $65,659 | $14,560 | $51,099 |
| 2018 | $14,300 | $65,613 | $12,600 | $53,013 |
| 2017 | $13,933 | $65,613 | $12,600 | $53,013 |
| 2016 | $13,351 | $65,613 | $12,600 | $53,013 |
| 2015 | $11,123 | $49,333 | $10,080 | $39,253 |
| 2014 | $10,932 | $49,333 | $10,080 | $39,253 |
| 2013 | $10,585 | $49,333 | $10,080 | $39,253 |
Source: Public Records
Map
Nearby Homes
- 1234 Depot St Unit 105
- 1222 Depot St Unit 1c
- 1220 Depot St Unit 305
- 2132 Rugen Rd Unit E
- 1410 Pebblecreek Dr Unit 153
- 1853 Prairie St Unit A4
- 1440 Elizabeth Ln
- 2238 Prairie St
- 1120 Raleigh Rd
- 2000 Chestnut Ave Unit 103
- 2000 Chestnut Ave Unit 407
- 1625 Glenview Rd Unit 103
- 1625 Glenview Rd Unit 207
- 1621 Glenview Rd Unit 225
- 1809 Jefferson Ave
- 1323 Tinker Way
- 1333 Tinker Way
- 1321 Tinker Way Unit 2
- 1345 Tinker Way
- 1332 Pine St
- 1328 Pine St
- 1334 Pine St
- 1324 Pine St
- 1317 Tinker Way
- 1349 Tinker Way
- 1318 Pine St
- 1324 Tinker Way
- 1324 Tinker Way Unit B
- 1324 Tinker Way Unit H
- 1324 Tinker Way Unit D
- 1324 Tinker Way Unit G
- 1324 Tinker Way
- 1324 Tinker Way Unit C
- 1324 Tinker Way Unit E
- 1341 Greenwillow Ln Unit G
Your Personal Tour Guide
Ask me questions while you tour the home.