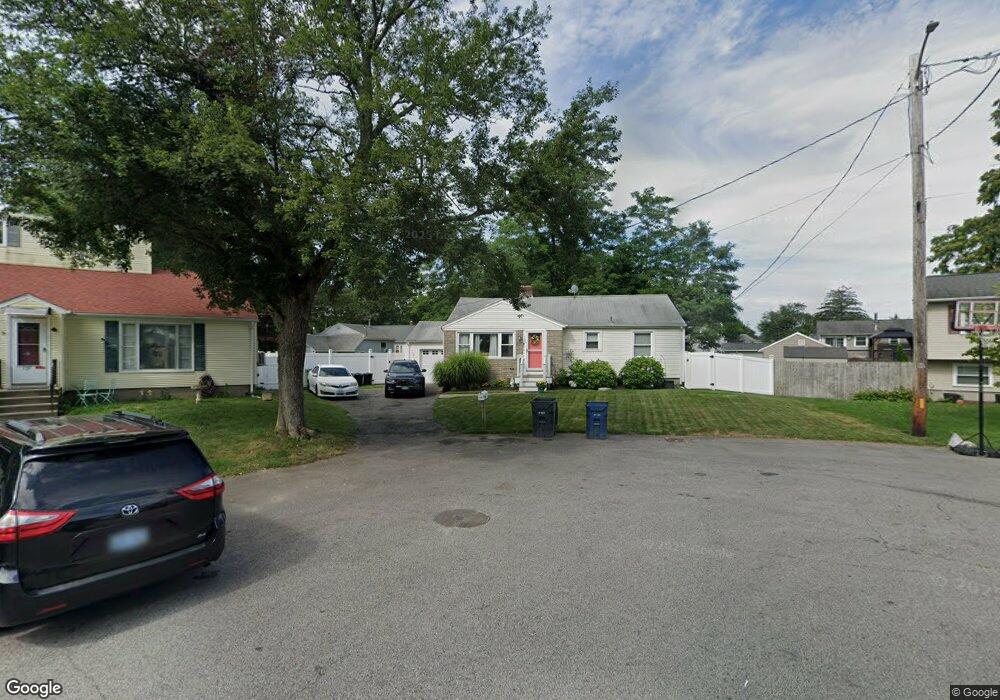
133 Moore St Warwick, RI 02889
Hoxie NeighborhoodEstimated Value: $367,200 - $418,000
3
Beds
1
Bath
1,160
Sq Ft
$337/Sq Ft
Est. Value
About This Home
This home is located at 133 Moore St, Warwick, RI 02889 and is currently estimated at $391,300, approximately $337 per square foot. 133 Moore St is a home located in Kent County with nearby schools including Saint Kevin School and Bishop Hendricken High School.
Ownership History
Date
Name
Owned For
Owner Type
Purchase Details
Closed on
May 23, 2023
Sold by
Lees Jonathan H and Lees Robert J
Bought by
Lees Jonathan H and Lees Amanda
Current Estimated Value
Purchase Details
Closed on
Aug 29, 2013
Sold by
Lees Robert J
Bought by
Lees Jonathan H and Lees Robert J
Create a Home Valuation Report for This Property
The Home Valuation Report is an in-depth analysis detailing your home's value as well as a comparison with similar homes in the area
Home Values in the Area
Average Home Value in this Area
Purchase History
We collect this data history from publicly available records. To have your information removed, we recommend requesting removal directly through your county’s website.
| Date | Buyer | Sale Price | Title Company |
|---|---|---|---|
| Lees Jonathan H | -- | None Available | |
| Lees Jonathan H | -- | -- |
Source: Public Records
Mortgage History
We collect this data history from publicly available records. To have your information removed, we recommend requesting removal directly through your county’s website.
| Date | Status | Borrower | Loan Amount |
|---|---|---|---|
| Previous Owner | Lees Jonathan H | $35,000 |
Source: Public Records
Tax History
| Year | Tax Paid | Tax Assessment Tax Assessment Total Assessment is a certain percentage of the fair market value that is determined by local assessors to be the total taxable value of land and additions on the property. | Land | Improvement |
|---|---|---|---|---|
| 2025 | $3,941 | $310,300 | $106,400 | $203,900 |
| 2024 | $3,849 | $266,000 | $92,500 | $173,500 |
| 2023 | $3,775 | $266,000 | $92,500 | $173,500 |
| 2022 | $3,662 | $195,500 | $65,000 | $130,500 |
| 2021 | $3,662 | $195,500 | $65,000 | $130,500 |
| 2020 | $3,662 | $195,500 | $65,000 | $130,500 |
| 2019 | $3,662 | $195,500 | $65,000 | $130,500 |
| 2018 | $3,209 | $154,300 | $65,000 | $89,300 |
| 2017 | $3,123 | $154,300 | $65,000 | $89,300 |
| 2016 | $3,123 | $154,300 | $65,000 | $89,300 |
| 2015 | $2,722 | $131,200 | $57,800 | $73,400 |
| 2014 | $2,632 | $131,200 | $57,800 | $73,400 |
| 2013 | $2,596 | $131,200 | $57,800 | $73,400 |
Source: Public Records
Map
Nearby Homes
Your Personal Tour Guide
Ask me questions while you tour the home.