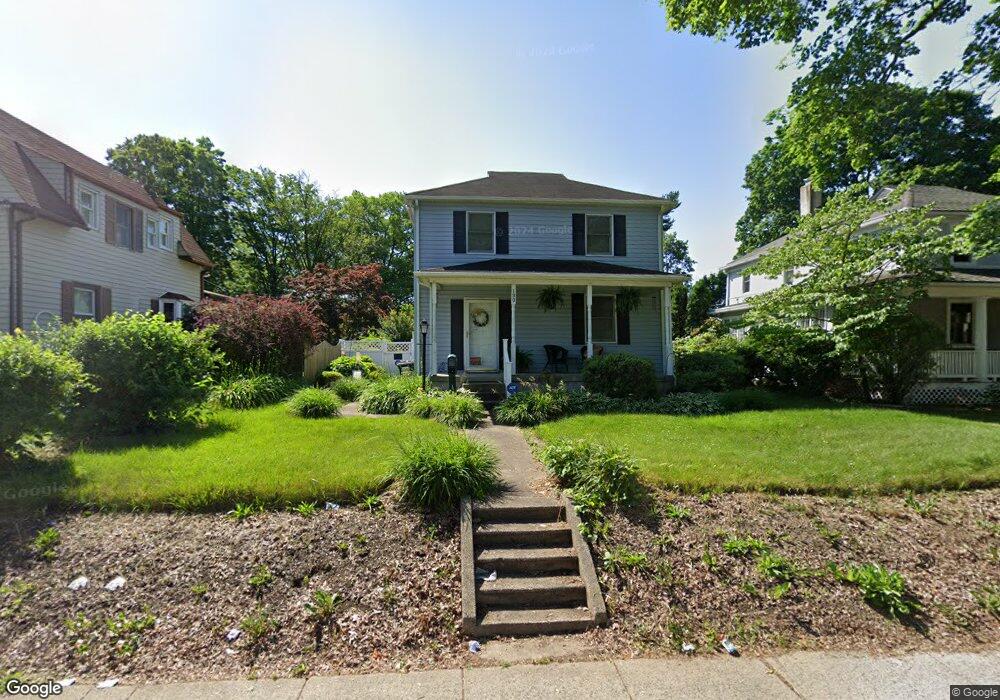
133 Old Post Rd Aberdeen, MD 21001
Estimated Value: $186,213 - $294,000
Studio
1
Bath
1,104
Sq Ft
$231/Sq Ft
Est. Value
About This Home
This home is located at 133 Old Post Rd, Aberdeen, MD 21001 and is currently estimated at $254,803, approximately $230 per square foot. 133 Old Post Rd is a home located in Harford County with nearby schools including Halls Cross Roads Elementary School, Aberdeen Middle School, and Aberdeen High School.
Ownership History
Date
Name
Owned For
Owner Type
Purchase Details
Closed on
Mar 1, 2004
Sold by
Norton Nannie M
Bought by
Norton Beverly Ruth
Current Estimated Value
Purchase Details
Closed on
May 1, 1990
Sold by
Noe Dwayne Lewis
Bought by
Davis Wesley B
Home Financials for this Owner
Home Financials are based on the most recent Mortgage that was taken out on this home.
Original Mortgage
$78,450
Interest Rate
10.56%
Create a Home Valuation Report for This Property
The Home Valuation Report is an in-depth analysis detailing your home's value as well as a comparison with similar homes in the area
Home Values in the Area
Average Home Value in this Area
Purchase History
| Date | Buyer | Sale Price | Title Company |
|---|---|---|---|
| Norton Beverly Ruth | -- | -- | |
| Davis Wesley B | $79,300 | -- |
Source: Public Records
Mortgage History
| Date | Status | Borrower | Loan Amount |
|---|---|---|---|
| Previous Owner | Davis Wesley B | $78,450 |
Source: Public Records
Tax History
| Year | Tax Paid | Tax Assessment Tax Assessment Total Assessment is a certain percentage of the fair market value that is determined by local assessors to be the total taxable value of land and additions on the property. | Land | Improvement |
|---|---|---|---|---|
| 2025 | $1,419 | $159,267 | $0 | $0 |
| 2024 | $1,334 | $150,433 | $0 | $0 |
| 2023 | $1,334 | $141,600 | $46,000 | $95,600 |
| 2022 | $1,525 | $139,933 | $0 | $0 |
| 2021 | $2,668 | $138,267 | $0 | $0 |
| 2020 | $1,374 | $136,600 | $46,000 | $90,600 |
| 2019 | $1,374 | $136,600 | $46,000 | $90,600 |
| 2018 | $1,362 | $136,600 | $46,000 | $90,600 |
| 2017 | $1,365 | $136,900 | $0 | $0 |
| 2016 | -- | $136,900 | $0 | $0 |
| 2015 | $1,466 | $136,900 | $0 | $0 |
| 2014 | $1,466 | $143,600 | $0 | $0 |
Source: Public Records
Map
Nearby Homes
Your Personal Tour Guide
Ask me questions while you tour the home.