
Landlord's Agent in 2024
Matthew McKenney
RE/MAX
(480) 233-4921
79 Total Sales
Estimated Value: $213,984 - $218,000
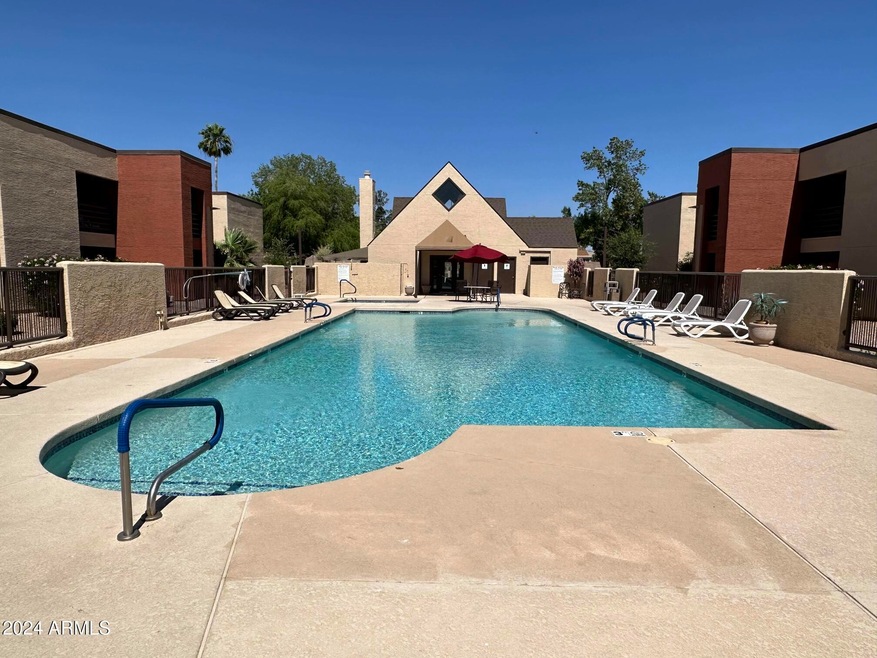
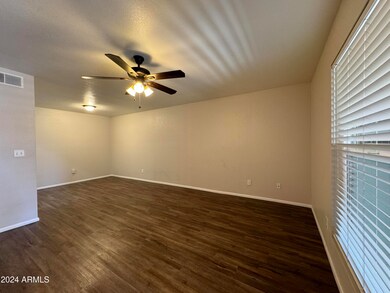
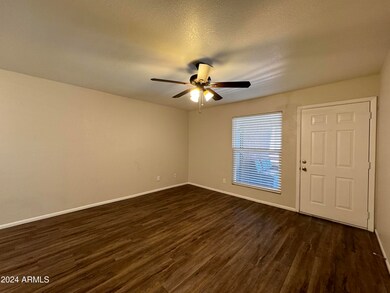
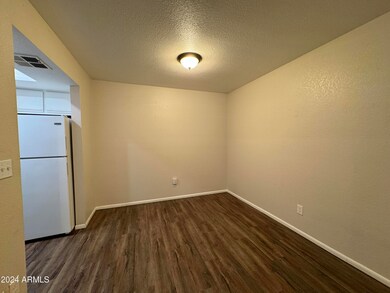
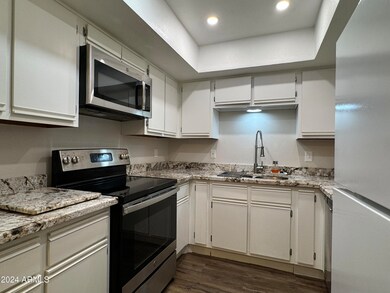
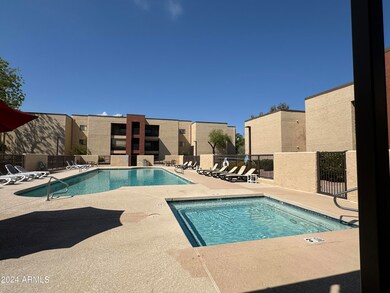
2 BR/2 BA Condo. Updated bathrooms and galley kitchen with fridge, ceramic cook top range, built-in micro and dishwasher. Lots of storage. Dining in family room. Large private patio with sunshade faces quad. In unit laundry with W/D. Water Incl. Dual pane windows; ceiling fans. Gated community, covered parking, community pool and easy access to 202 Freeway, Red Mountain CC and Superstition recreational areas.
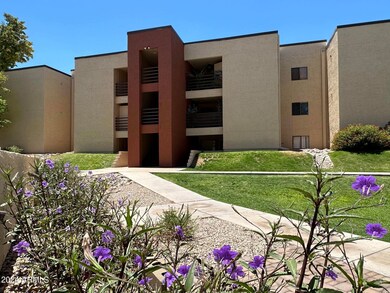
3rd floor walk-up. One NEUTERED cat ONLY. NO SMOKING. Owner reserves right to increase deposits. Sample lease avail on request. Unfurnished. 12-mo lease w/option to renew. No corporate or subleasing. $65/adult nonrefundable app fee. Approved applicant pays $500 hold deposit in 24 hours & takes possession within 15 days. Renter verifies all facts, figures & school district info.
Last Agent to Rent the Property
McKenney Realty LLC License #BR556237000 Listed on: 10/07/2024
We collect this data history from publicly available records. To have your information removed, we recommend requesting removal directly through your county’s website.
| Date | Buyer | Sale Price | Title Company |
|---|---|---|---|
| Task Properties Llc | $133,000 | Fidelity Natl Ttl Agcy Inc | |
| Tidwell Dean | $146,902 | Fidelity National Title |
We collect this data history from publicly available records. To have your information removed, we recommend requesting removal directly through your county’s website.
| Date | Status | Borrower | Loan Amount |
|---|---|---|---|
| Previous Owner | Tidwell Dean | $117,500 |
| Date | Event | Price | List to Sale | Price per Sq Ft | Prior Sale |
|---|---|---|---|---|---|
| 10/26/2024 10/26/24 | Rented | $1,395 | 0.0% | -- | |
| 10/18/2024 10/18/24 | Under Contract | -- | -- | -- | |
| 10/07/2024 10/07/24 | For Rent | $1,395 | +5.3% | -- | |
| 07/01/2023 07/01/23 | Rented | $1,325 | 0.0% | -- | |
| 06/28/2023 06/28/23 | Under Contract | -- | -- | -- | |
| 06/20/2023 06/20/23 | For Rent | $1,325 | +20.5% | -- | |
| 05/30/2020 05/30/20 | Rented | $1,100 | 0.0% | -- | |
| 05/27/2020 05/27/20 | Under Contract | -- | -- | -- | |
| 05/25/2020 05/25/20 | For Rent | $1,100 | 0.0% | -- | |
| 04/03/2020 04/03/20 | Sold | $133,000 | -8.9% | $147 / Sq Ft | View Prior Sale |
| 03/06/2020 03/06/20 | Pending | -- | -- | -- | |
| 03/06/2020 03/06/20 | For Sale | $146,000 | 0.0% | $162 / Sq Ft | |
| 03/06/2020 03/06/20 | Price Changed | $146,000 | 0.0% | $162 / Sq Ft | |
| 03/05/2020 03/05/20 | Pending | -- | -- | -- | |
| 02/29/2020 02/29/20 | For Sale | $146,000 | +9.8% | $162 / Sq Ft | |
| 02/14/2020 02/14/20 | Off Market | $133,000 | -- | -- | |
| 02/09/2020 02/09/20 | For Sale | $146,000 | +9.8% | $162 / Sq Ft | |
| 02/06/2020 02/06/20 | Off Market | $133,000 | -- | -- | |
| 01/31/2020 01/31/20 | For Sale | $146,000 | 0.0% | $162 / Sq Ft | |
| 09/01/2017 09/01/17 | Rented | $795 | 0.0% | -- | |
| 08/18/2017 08/18/17 | Under Contract | -- | -- | -- | |
| 08/18/2017 08/18/17 | For Rent | $795 | 0.0% | -- | |
| 08/07/2017 08/07/17 | Under Contract | -- | -- | -- | |
| 08/02/2017 08/02/17 | Price Changed | $795 | -3.6% | $1 / Sq Ft | |
| 07/19/2017 07/19/17 | For Rent | $825 | 0.0% | -- | |
| 07/17/2017 07/17/17 | Under Contract | -- | -- | -- | |
| 07/17/2017 07/17/17 | For Rent | $825 | 0.0% | -- | |
| 07/14/2017 07/14/17 | Under Contract | -- | -- | -- | |
| 07/07/2017 07/07/17 | Price Changed | $825 | -7.8% | $1 / Sq Ft | |
| 06/29/2017 06/29/17 | For Rent | $895 | 0.0% | -- | |
| 06/25/2017 06/25/17 | Off Market | $895 | -- | -- | |
| 06/22/2017 06/22/17 | For Rent | $895 | +8.5% | -- | |
| 05/27/2016 05/27/16 | Rented | $825 | 0.0% | -- | |
| 05/11/2016 05/11/16 | Under Contract | -- | -- | -- | |
| 04/21/2016 04/21/16 | Price Changed | $825 | -2.9% | $1 / Sq Ft | |
| 03/23/2016 03/23/16 | For Rent | $850 | +19.7% | -- | |
| 11/16/2012 11/16/12 | Rented | $710 | -5.3% | -- | |
| 11/13/2012 11/13/12 | Under Contract | -- | -- | -- | |
| 09/27/2012 09/27/12 | For Rent | $750 | -- | -- |
| Year | Tax Paid | Tax Assessment Tax Assessment Total Assessment is a certain percentage of the fair market value that is determined by local assessors to be the total taxable value of land and additions on the property. | Land | Improvement |
|---|---|---|---|---|
| 2025 | $557 | $5,644 | -- | -- |
| 2024 | $559 | $5,375 | -- | -- |
| 2023 | $559 | $15,430 | $3,080 | $12,350 |
| 2022 | $547 | $12,420 | $2,480 | $9,940 |
| 2021 | $554 | $10,680 | $2,130 | $8,550 |
| 2020 | $546 | $9,420 | $1,880 | $7,540 |
| 2019 | $511 | $8,550 | $1,710 | $6,840 |
| 2018 | $490 | $7,820 | $1,560 | $6,260 |
| 2017 | $475 | $7,330 | $1,460 | $5,870 |
| 2016 | $467 | $6,660 | $1,330 | $5,330 |
| 2015 | $439 | $5,900 | $1,180 | $4,720 |
Landlord's Agent in 2024
Matthew McKenney
RE/MAX
(480) 233-4921
79 Total Sales
L
Buyer's Agent in 2017
Laurelen Smolik
Valley King Properties, LLC
(480) 945-1111
3 Total Sales
D
Buyer's Agent in 2012
DeAnna Bindley
West USA Realty
Source: Arizona Regional Multiple Listing Service (ARMLS)
MLS Number: 6767916
APN: 141-88-255
Disclaimer: Certain information contained herein is derived from information provided by parties other than Homes.com. All information provided is deemed reliable, but is not guaranteed to be accurate and should be independently verified.
![]() All information should be verified by the recipient and none is guaranteed as accurate by ARMLS
All information should be verified by the recipient and none is guaranteed as accurate by ARMLS
Listing Information presented by local MLS brokerage: Ten-X, local REALTOR®- Arlene Richardson - (888)-952-6393
Ask me questions while you tour the home.