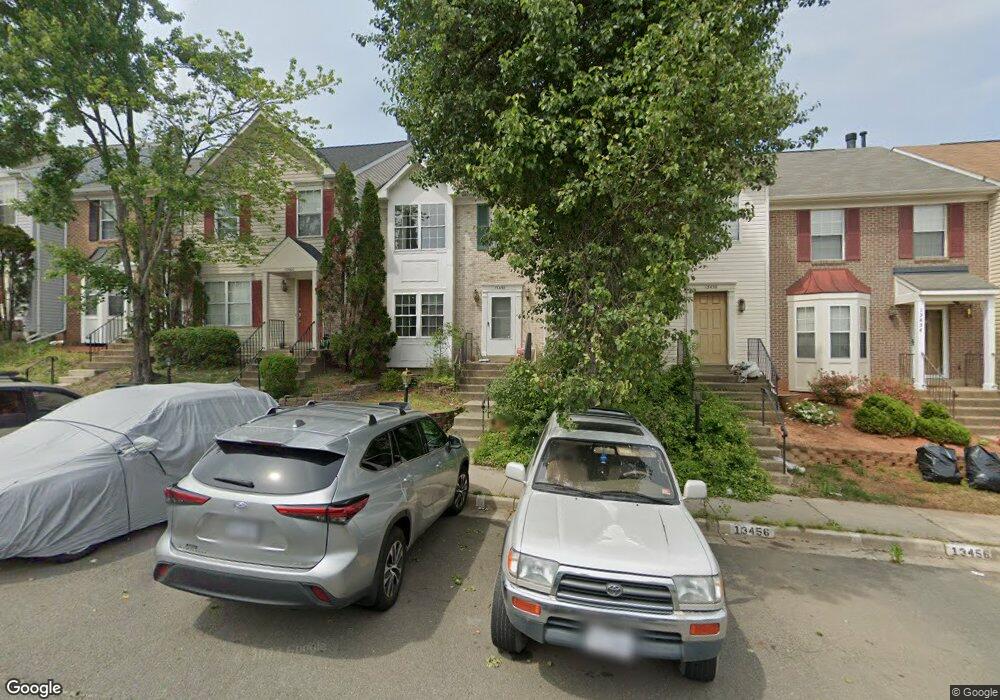
13458 Lock Loop Woodbridge, VA 22192
Old Bridge NeighborhoodEstimated Value: $442,000 - $458,000
3
Beds
4
Baths
1,420
Sq Ft
$316/Sq Ft
Est. Value
About This Home
This home is located at 13458 Lock Loop, Woodbridge, VA 22192 and is currently estimated at $449,201, approximately $316 per square foot. 13458 Lock Loop is a home located in Prince William County with nearby schools including Gar-Field High School, John D. Jenkins Elementary School, and Woodbridge Middle School.
Ownership History
Date
Name
Owned For
Owner Type
Purchase Details
Closed on
Aug 26, 2008
Sold by
Yapur Eduardo
Bought by
Abdalla Yassir M
Current Estimated Value
Home Financials for this Owner
Home Financials are based on the most recent Mortgage that was taken out on this home.
Original Mortgage
$188,049
Outstanding Balance
$123,693
Interest Rate
6.29%
Mortgage Type
FHA
Estimated Equity
$325,508
Purchase Details
Closed on
Nov 18, 2005
Sold by
Aguilar Margarita E
Bought by
Yapur Eduardo
Home Financials for this Owner
Home Financials are based on the most recent Mortgage that was taken out on this home.
Original Mortgage
$278,400
Interest Rate
6.07%
Mortgage Type
New Conventional
Purchase Details
Closed on
Jun 27, 2001
Sold by
Cole Floratina R Roberson
Bought by
Aguilar Margarita E
Home Financials for this Owner
Home Financials are based on the most recent Mortgage that was taken out on this home.
Original Mortgage
$133,184
Interest Rate
7.14%
Create a Home Valuation Report for This Property
The Home Valuation Report is an in-depth analysis detailing your home's value as well as a comparison with similar homes in the area
Home Values in the Area
Average Home Value in this Area
Purchase History
| Date | Buyer | Sale Price | Title Company |
|---|---|---|---|
| Abdalla Yassir M | $191,000 | -- | |
| Yapur Eduardo | $348,000 | -- | |
| Aguilar Margarita E | $135,000 | -- |
Source: Public Records
Mortgage History
| Date | Status | Borrower | Loan Amount |
|---|---|---|---|
| Open | Abdalla Yassir M | $188,049 | |
| Previous Owner | Yapur Eduardo | $278,400 | |
| Previous Owner | Aguilar Margarita E | $133,184 |
Source: Public Records
Tax History
| Year | Tax Paid | Tax Assessment Tax Assessment Total Assessment is a certain percentage of the fair market value that is determined by local assessors to be the total taxable value of land and additions on the property. | Land | Improvement |
|---|---|---|---|---|
| 2025 | $4,059 | $430,400 | $134,100 | $296,300 |
| 2024 | $4,059 | $408,100 | $126,800 | $281,300 |
| 2023 | $3,913 | $376,100 | $118,800 | $257,300 |
| 2022 | $3,936 | $355,400 | $111,600 | $243,800 |
| 2021 | $4,002 | $326,500 | $111,600 | $214,900 |
| 2020 | $4,817 | $310,800 | $111,600 | $199,200 |
| 2019 | $4,275 | $275,800 | $98,800 | $177,000 |
| 2018 | $3,234 | $267,800 | $95,900 | $171,900 |
| 2017 | $3,096 | $248,900 | $88,800 | $160,100 |
| 2016 | $3,081 | $250,100 | $88,800 | $161,300 |
| 2015 | $2,694 | $241,500 | $85,400 | $156,100 |
| 2014 | $2,694 | $213,100 | $74,900 | $138,200 |
Source: Public Records
Map
Nearby Homes
- 13413 Classic Ct
- 3454 Vale Ct
- 3450 Vale Ct
- 3449 Chelsea Dr
- 13505 Getty Ln
- 3331 Wyndale Ct
- 13668 Cobble Loop
- 13670 Cobble Loop
- 13658 Cobble Loop
- 13674 Cobble Loop
- 3460 Brookville Ln
- 3622 Agate Ln
- 3626 Agate Ln
- 3630 Agate Ln
- 13712 Cobble Loop
- 13814 Quartz Ave
- 13714 Cobble Loop
- 13713 Cobble Loop
- 13818 Quartz Ave
- 13717 Cobble Loop
- 13460 Lock Loop
- 13456 Lock Loop
- 13462 Lock Loop
- 13454 Lock Loop
- 13464 Lock Loop
- 13452 Lock Loop
- 13466 Lock Loop
- 13450 Lock Loop
- 13530 Lock Loop
- 13504 Minion St
- 13468 Lock Loop
- 13440 Lock Loop
- 13459 Lock Loop
- 13489 Lock Loop
- 13457 Lock Loop
- 13455 Lock Loop
- 13472 Lock Loop
- 13453 Lock Loop
- 13491 Lock Loop
- 13451 Lock Loop
Your Personal Tour Guide
Ask me questions while you tour the home.