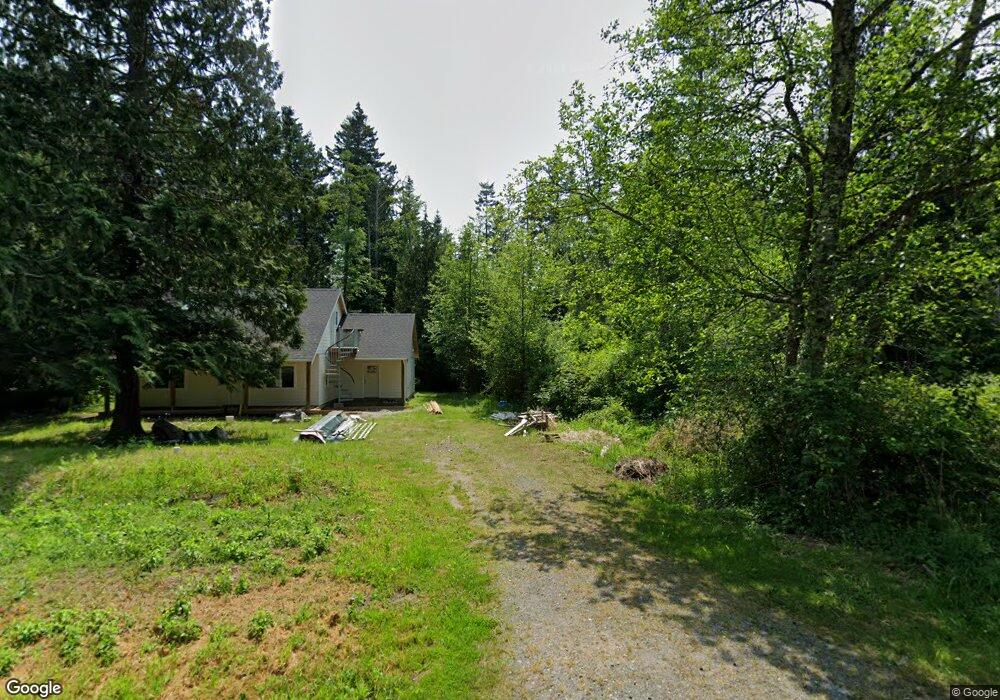
1349 Rex St Point Roberts, WA 98281
Estimated Value: $442,321 - $613,000
2
Beds
2
Baths
1,528
Sq Ft
$328/Sq Ft
Est. Value
About This Home
This home is located at 1349 Rex St, Point Roberts, WA 98281 and is currently estimated at $501,830, approximately $328 per square foot. 1349 Rex St is a home with nearby schools including Point Roberts Primary School, Blaine Middle School, and Blaine High School.
Ownership History
Date
Name
Owned For
Owner Type
Purchase Details
Closed on
May 21, 2021
Sold by
Zohar Laura Sampson
Bought by
Zohar Jordan Raye
Current Estimated Value
Purchase Details
Closed on
Jun 2, 2009
Sold by
Zohar Shmuel
Bought by
Zohar Laura Sampson
Purchase Details
Closed on
May 1, 2006
Sold by
Ginn Michael
Bought by
Shaw Martyn and Shaw Tammy
Purchase Details
Closed on
Dec 13, 2004
Sold by
Cory Barbara J
Bought by
Ginn Michael
Create a Home Valuation Report for This Property
The Home Valuation Report is an in-depth analysis detailing your home's value as well as a comparison with similar homes in the area
Home Values in the Area
Average Home Value in this Area
Purchase History
| Date | Buyer | Sale Price | Title Company |
|---|---|---|---|
| Zohar Jordan Raye | -- | None Available | |
| Zohar Jordan | -- | None Listed On Document | |
| Zohar Laura Sampson | -- | Whatcom Land Title | |
| Zohar Laura Sampson | $55,280 | Whatcom Land Title | |
| Shaw Martyn | $34,280 | Whatcom Land Title | |
| Ginn Michael | $10,200 | -- |
Source: Public Records
Tax History
| Year | Tax Paid | Tax Assessment Tax Assessment Total Assessment is a certain percentage of the fair market value that is determined by local assessors to be the total taxable value of land and additions on the property. | Land | Improvement |
|---|---|---|---|---|
| 2025 | $3,110 | $403,914 | $103,403 | $300,511 |
| 2024 | $2,908 | $399,905 | $102,383 | $297,522 |
| 2023 | $2,908 | $375,868 | $93,075 | $282,793 |
| 2022 | $1,936 | $208,975 | $85,000 | $123,975 |
| 2021 | $1,039 | $209,311 | $42,134 | $167,177 |
| 2020 | $279 | $103,574 | $27,418 | $76,156 |
| 2019 | $277 | $25,578 | $25,578 | $0 |
| 2018 | $301 | $24,696 | $24,696 | $0 |
| 2017 | $273 | $24,696 | $24,696 | $0 |
| 2016 | $294 | $25,200 | $25,200 | $0 |
| 2015 | $304 | $26,490 | $26,490 | $0 |
| 2014 | -- | $26,970 | $26,970 | $0 |
| 2013 | -- | $30,000 | $30,000 | $0 |
Source: Public Records
Map
Nearby Homes
- 1394 Rex St
- 329 Gulf View Crescent
- 230 Iris Blvd
- Lot #8 Marine Dr
- 585 Marine Dr
- 279 Marine Dr
- 211 Marine Dr
- 1334 Gulf Rd
- 1542 Columbia Vista Dr
- 1379 Gulf Rd
- 1525 Columbia Vista Dr
- 1438 Gulf Rd
- 1361 Peltier Dr
- 1440 Peltier Dr
- 1427 Mckenzie Way
- 1427 Peltier Dr
- 1555 Panorama Dr
- 465 Tyee Dr
- 631 Freemans Ln
- 157 Northwood Dr
Your Personal Tour Guide
Ask me questions while you tour the home.