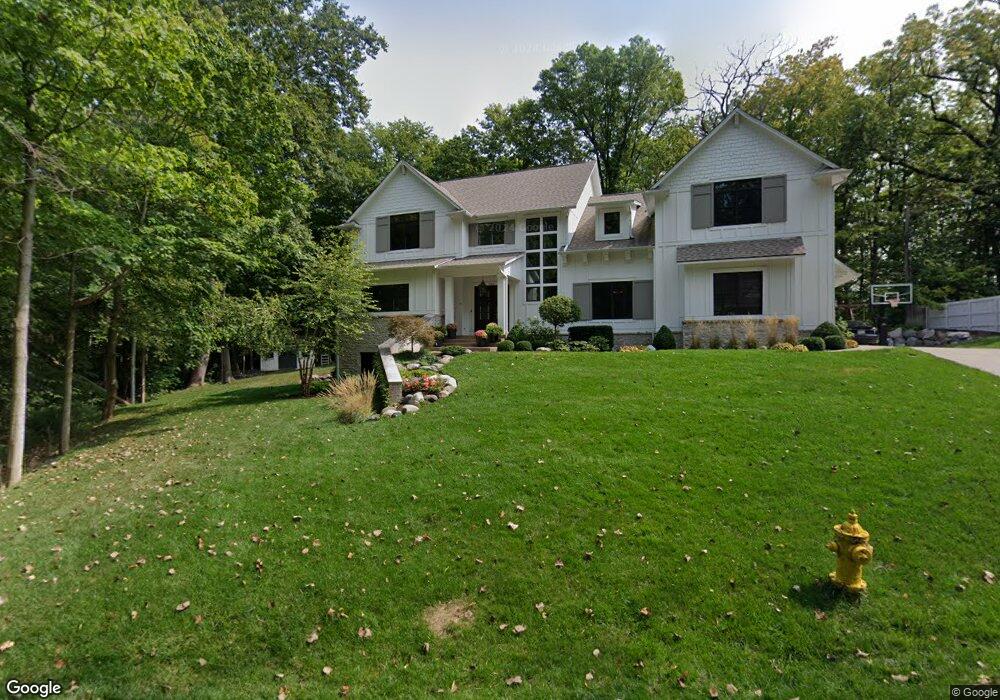
135 Audubon Dr Carmel, IN 46032
Downtown Carmel NeighborhoodEstimated Value: $1,369,805 - $2,146,000
3
Beds
5
Baths
4,069
Sq Ft
$395/Sq Ft
Est. Value
About This Home
This home is located at 135 Audubon Dr, Carmel, IN 46032 and is currently estimated at $1,605,451, approximately $394 per square foot. 135 Audubon Dr is a home located in Hamilton County with nearby schools including Carmel Elementary School, Carmel Middle School, and Carmel High School.
Ownership History
Date
Name
Owned For
Owner Type
Purchase Details
Closed on
Nov 14, 2016
Sold by
Kirsh Grant M
Bought by
Krish Grant M and Krish Ann E
Current Estimated Value
Home Financials for this Owner
Home Financials are based on the most recent Mortgage that was taken out on this home.
Original Mortgage
$213,600
Outstanding Balance
$170,537
Interest Rate
3.75%
Mortgage Type
Adjustable Rate Mortgage/ARM
Estimated Equity
$1,434,914
Purchase Details
Closed on
Apr 29, 2013
Sold by
Overmeiren Sally M Van
Bought by
Krish Grant M
Home Financials for this Owner
Home Financials are based on the most recent Mortgage that was taken out on this home.
Original Mortgage
$144,000
Interest Rate
3.87%
Mortgage Type
Adjustable Rate Mortgage/ARM
Purchase Details
Closed on
May 15, 2010
Sold by
Vanovermeiren Frank L
Bought by
Vanovermeiren Sally M
Home Financials for this Owner
Home Financials are based on the most recent Mortgage that was taken out on this home.
Original Mortgage
$125,406
Interest Rate
4.5%
Mortgage Type
FHA
Create a Home Valuation Report for This Property
The Home Valuation Report is an in-depth analysis detailing your home's value as well as a comparison with similar homes in the area
Home Values in the Area
Average Home Value in this Area
Purchase History
| Date | Buyer | Sale Price | Title Company |
|---|---|---|---|
| Krish Grant M | -- | None Available | |
| Krish Grant M | -- | None Available | |
| Vanovermeiren Sally M | -- | Prism Title & Closing Servic |
Source: Public Records
Mortgage History
| Date | Status | Borrower | Loan Amount |
|---|---|---|---|
| Open | Krish Grant M | $213,600 | |
| Previous Owner | Krish Grant M | $144,000 | |
| Previous Owner | Vanovermeiren Sally M | $125,406 |
Source: Public Records
Tax History
| Year | Tax Paid | Tax Assessment Tax Assessment Total Assessment is a certain percentage of the fair market value that is determined by local assessors to be the total taxable value of land and additions on the property. | Land | Improvement |
|---|---|---|---|---|
| 2025 | $11,335 | $1,045,700 | $192,300 | $853,400 |
| 2024 | $11,363 | $984,900 | $192,300 | $792,600 |
| 2023 | $11,363 | $993,100 | $192,300 | $800,800 |
| 2022 | $9,734 | $844,600 | $192,300 | $652,300 |
| 2021 | $9,019 | $790,300 | $192,300 | $598,000 |
| 2020 | $9,019 | $790,300 | $192,300 | $598,000 |
| 2019 | $6,748 | $595,000 | $192,300 | $402,700 |
| 2018 | $2,648 | $249,800 | $125,400 | $124,400 |
| 2017 | $2,629 | $249,000 | $125,400 | $123,600 |
| 2016 | $2,688 | $251,500 | $125,400 | $126,100 |
| 2014 | $2,296 | $230,100 | $105,900 | $124,200 |
| 2013 | $2,296 | $230,100 | $105,900 | $124,200 |
Source: Public Records
Map
Nearby Homes
- 310 2nd St NE
- 320 2nd St NE
- 712 E Main St
- 41 N Rangeline Rd Unit 306
- 610 N Rangeline Rd
- 30 W Main St Unit B
- 984 Bard Ln
- 751 1st Ave NW
- 305 Concord Ln
- 781 1st Ave NW
- 220 1st Ave SE
- 41 1st Ave SW
- 124 9th St NW
- 994 2nd Ave NW
- 692 Greenford Trail N
- 2895 Twain Dr
- 13994 Matt St
- 1037 Foxglove Cir
- 428 Neuman Way
- 105 Carmelaire Dr
Your Personal Tour Guide
Ask me questions while you tour the home.