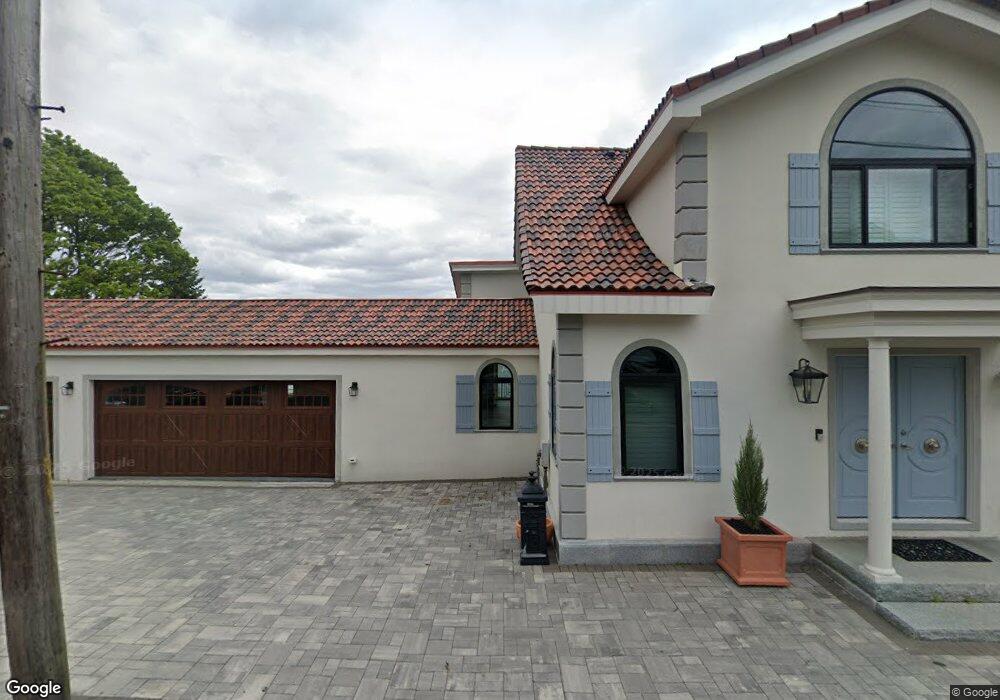
135 Castle Rd Nahant, MA 01908
Estimated Value: $1,520,000 - $1,930,094
2
Beds
2
Baths
2,524
Sq Ft
$722/Sq Ft
Est. Value
About This Home
This home is located at 135 Castle Rd, Nahant, MA 01908 and is currently estimated at $1,821,524, approximately $721 per square foot. 135 Castle Rd is a home located in Essex County with nearby schools including Johnson Elementary School, Swampscott Middle School, and Swampscott High School.
Ownership History
Date
Name
Owned For
Owner Type
Purchase Details
Closed on
Mar 24, 2026
Sold by
Deluca Joel
Bought by
135 Castle Rd Rt and Deluca
Current Estimated Value
Purchase Details
Closed on
Mar 11, 2022
Sold by
Deluca Anthony A Est and Deluca
Bought by
Deluca Joel
Purchase Details
Closed on
Sep 7, 1999
Sold by
Shannon Rosemary
Bought by
Deluca Anthony
Create a Home Valuation Report for This Property
The Home Valuation Report is an in-depth analysis detailing your home's value as well as a comparison with similar homes in the area
Home Values in the Area
Average Home Value in this Area
Purchase History
We collect this data history from publicly available records. To have your information removed, we recommend requesting removal directly through your county’s website.
| Date | Buyer | Sale Price | Title Company |
|---|---|---|---|
| 135 Castle Rd Rt | -- | -- | |
| Deluca Joel | -- | None Available | |
| Deluca Joel | -- | None Available | |
| Deluca Joel | -- | None Available | |
| Deluca Anthony | $340,000 | -- | |
| Deluca Anthony F | $340,000 | -- |
Source: Public Records
Mortgage History
We collect this data history from publicly available records. To have your information removed, we recommend requesting removal directly through your county’s website.
| Date | Status | Borrower | Loan Amount |
|---|---|---|---|
| Previous Owner | Deluca Anthony F | $650,000 | |
| Previous Owner | Deluca Anthony F | $500,000 | |
| Previous Owner | Deluca Anthony F | $275,000 |
Source: Public Records
Tax History
| Year | Tax Paid | Tax Assessment Tax Assessment Total Assessment is a certain percentage of the fair market value that is determined by local assessors to be the total taxable value of land and additions on the property. | Land | Improvement |
|---|---|---|---|---|
| 2025 | $17,032 | $1,861,400 | $664,500 | $1,196,900 |
| 2024 | $15,552 | $1,714,700 | $664,500 | $1,050,200 |
| 2023 | $13,343 | $1,467,900 | $644,100 | $823,800 |
| 2022 | $12,986 | $1,326,500 | $582,700 | $743,800 |
| 2021 | $12,942 | $1,231,400 | $531,600 | $699,800 |
| 2020 | $12,456 | $1,135,500 | $531,600 | $603,900 |
| 2019 | $11,511 | $1,055,100 | $511,200 | $543,900 |
| 2018 | $10,168 | $992,000 | $460,100 | $531,900 |
| 2017 | $10,386 | $992,000 | $460,100 | $531,900 |
| 2016 | $10,003 | $950,900 | $439,600 | $511,300 |
| 2015 | $10,043 | $919,700 | $408,400 | $511,300 |
| 2014 | $9,733 | $882,400 | $371,100 | $511,300 |
Source: Public Records
Map
Nearby Homes
- 51 Fox Hill Rd
- 43 Maple Ave
- 22 Sherman Ave
- 1 Goddard Dr
- 85 Willow Rd
- 250 Wilson Rd
- 66 Ocean St
- 5 Cottage St
- 303 Nahant Rd
- 162 Willow Rd Unit 11
- 6 Desmond Dr
- 51 Cliff St
- 33 Pines Rd
- 21 Harrington Ave
- 15 Whitin Ave
- 19 John Ave
- 510 Revere Beach Blvd Unit 1004
- 510 Revere Beach Blvd Unit 201
- 510 Revere Beach Blvd Unit 1205
- 150 Lynnway Unit 403
Your Personal Tour Guide
Ask me questions while you tour the home.