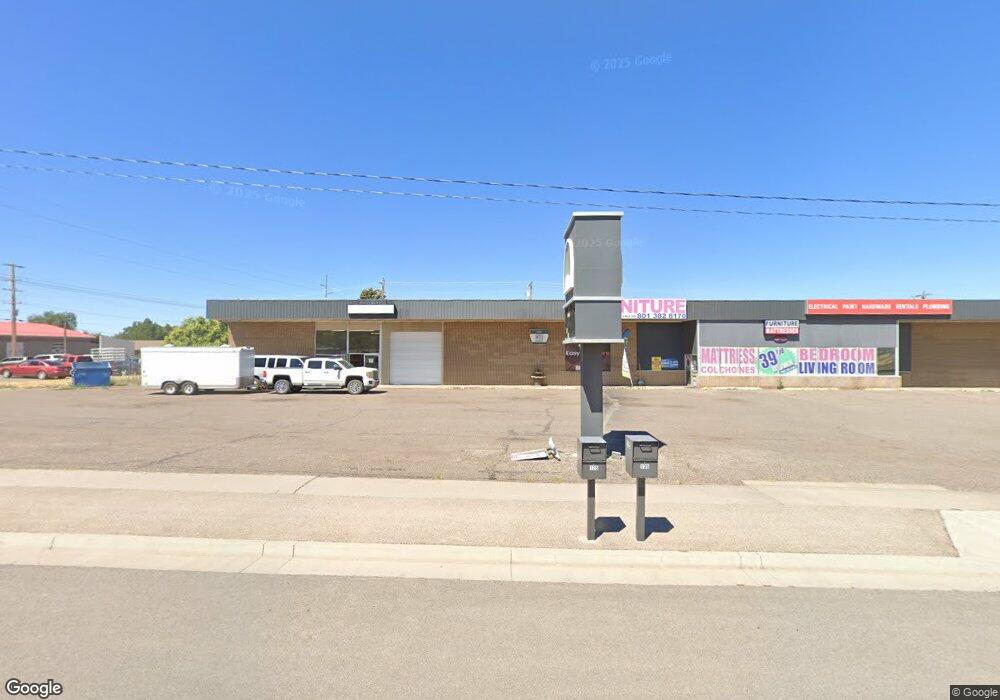
135 N Main St Fillmore, UT 84631
Studio
--
Bath
--
Sq Ft
0.99
Acres Lot
About This Home
This home is located at 135 N Main St, Fillmore, UT 84631. 135 N Main St is a home located in Millard County.
Ownership History
Date
Name
Owned For
Owner Type
Purchase Details
Closed on
Jun 29, 2021
Sold by
Sidwell Properties Llc
Bought by
Smoot Shea T
Purchase Details
Closed on
Jun 22, 2021
Sold by
Smoot Shea T
Bought by
Sidwell Properties Llc
Purchase Details
Closed on
Jun 20, 2008
Sold by
Drb & Sons Inc
Bought by
Sidwell Properties Llc
Home Financials for this Owner
Home Financials are based on the most recent Mortgage that was taken out on this home.
Original Mortgage
$749,000
Interest Rate
6.35%
Mortgage Type
Commercial
Create a Home Valuation Report for This Property
The Home Valuation Report is an in-depth analysis detailing your home's value as well as a comparison with similar homes in the area
Home Values in the Area
Average Home Value in this Area
Purchase History
| Date | Buyer | Sale Price | Title Company |
|---|---|---|---|
| Smoot Shea T | -- | Us Title Insurance Agency | |
| Sidwell Properties Llc | -- | Us Title Insurance Agency | |
| Sidwell Properties Llc | -- | -- |
Source: Public Records
Mortgage History
| Date | Status | Borrower | Loan Amount |
|---|---|---|---|
| Previous Owner | Sidwell Properties Llc | $749,000 |
Source: Public Records
Tax History
| Year | Tax Paid | Tax Assessment Tax Assessment Total Assessment is a certain percentage of the fair market value that is determined by local assessors to be the total taxable value of land and additions on the property. | Land | Improvement |
|---|---|---|---|---|
| 2025 | $4,304 | $540,610 | $93,654 | $446,956 |
| 2024 | $4,304 | $506,726 | $75,672 | $431,054 |
| 2023 | $5,017 | $506,726 | $75,672 | $431,054 |
| 2022 | $5,568 | $499,983 | $68,929 | $431,054 |
| 2021 | $5,527 | $476,471 | $68,929 | $407,542 |
| 2020 | $5,495 | $476,471 | $68,929 | $407,542 |
| 2019 | $5,478 | $476,471 | $68,929 | $407,542 |
| 2018 | $5,352 | $476,471 | $68,929 | $407,542 |
| 2017 | $4,995 | $422,776 | $71,600 | $351,176 |
| 2016 | $4,777 | $422,776 | $71,600 | $351,176 |
| 2015 | $4,779 | $422,776 | $71,600 | $351,176 |
| 2014 | -- | $422,776 | $71,600 | $351,176 |
| 2013 | -- | $422,776 | $71,600 | $351,176 |
Source: Public Records
Map
Nearby Homes
Your Personal Tour Guide
Ask me questions while you tour the home.