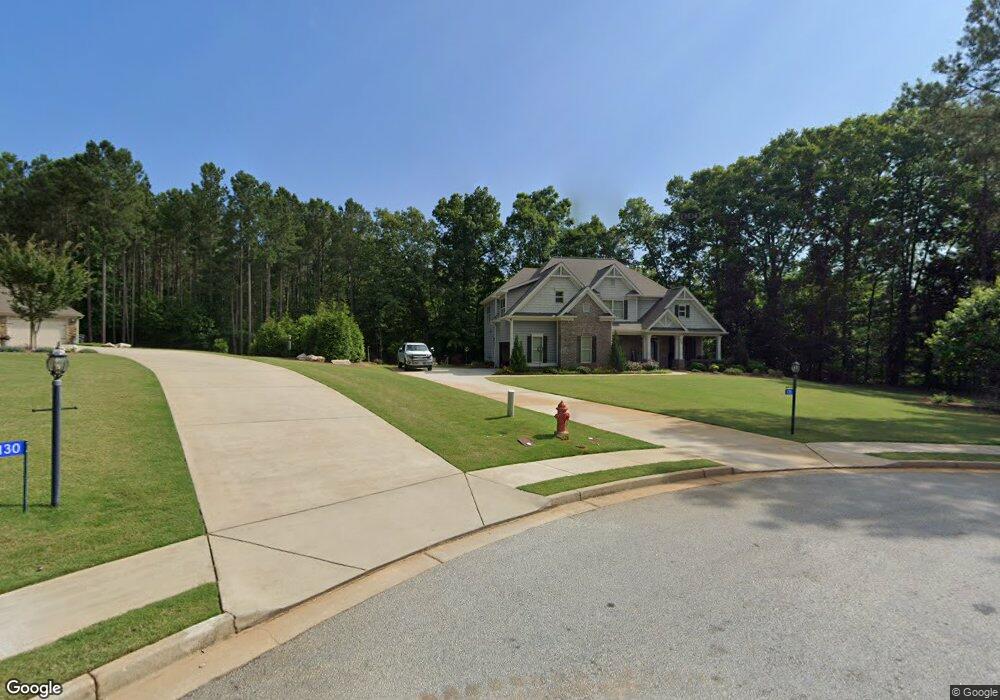
135 Spring Creek Dr Rutledge, GA 30663
Estimated Value: $584,371 - $772,000
4
Beds
3
Baths
3,500
Sq Ft
$186/Sq Ft
Est. Value
About This Home
This home is located at 135 Spring Creek Dr, Rutledge, GA 30663 and is currently estimated at $652,093, approximately $186 per square foot. 135 Spring Creek Dr is a home located in Morgan County with nearby schools including Morgan County Primary School, Morgan County Elementary School, and Morgan County Middle School.
Ownership History
Date
Name
Owned For
Owner Type
Purchase Details
Closed on
May 24, 2022
Sold by
Kitchens Wayne
Bought by
Kitchens Family Trust
Current Estimated Value
Purchase Details
Closed on
Dec 15, 2020
Sold by
Lowry Kevin J
Bought by
Kitchens Wayne and Kitchens Bonnie
Purchase Details
Closed on
Oct 3, 2017
Sold by
Lowry Autumn
Bought by
Lowry Kevin J
Purchase Details
Closed on
Aug 31, 2015
Sold by
Hidden Falls Development L
Bought by
Lowry Kevin J and Lowry Autumn
Home Financials for this Owner
Home Financials are based on the most recent Mortgage that was taken out on this home.
Original Mortgage
$219,920
Interest Rate
4.02%
Mortgage Type
New Conventional
Purchase Details
Closed on
Aug 16, 2014
Sold by
Smith Jerry O
Bought by
Hidden Falls Development Llc
Purchase Details
Closed on
Sep 30, 2011
Sold by
Synovus Bank
Bought by
Smith Jerry
Purchase Details
Closed on
Feb 1, 2011
Sold by
Rutledge Land Development Llc
Bought by
Bank Of North Georgia
Create a Home Valuation Report for This Property
The Home Valuation Report is an in-depth analysis detailing your home's value as well as a comparison with similar homes in the area
Home Values in the Area
Average Home Value in this Area
Purchase History
| Date | Buyer | Sale Price | Title Company |
|---|---|---|---|
| Kitchens Family Trust | -- | -- | |
| Kitchens Wayne | $382,500 | -- | |
| Lowry Kevin J | -- | -- | |
| Lowry Kevin J | $291,980 | -- | |
| Hidden Falls Development Llc | -- | -- | |
| Smith Jerry | $198,000 | -- | |
| Bank Of North Georgia | -- | -- |
Source: Public Records
Mortgage History
| Date | Status | Borrower | Loan Amount |
|---|---|---|---|
| Previous Owner | Lowry Kevin J | $219,920 |
Source: Public Records
Tax History
| Year | Tax Paid | Tax Assessment Tax Assessment Total Assessment is a certain percentage of the fair market value that is determined by local assessors to be the total taxable value of land and additions on the property. | Land | Improvement |
|---|---|---|---|---|
| 2025 | $4,517 | $208,488 | $18,400 | $190,088 |
| 2024 | $4,590 | $188,480 | $14,400 | $174,080 |
| 2023 | $4,107 | $164,994 | $14,400 | $150,594 |
| 2022 | $4,040 | $156,686 | $14,400 | $142,286 |
| 2021 | $3,901 | $151,041 | $12,600 | $138,441 |
| 2020 | $3,852 | $139,104 | $12,600 | $126,504 |
| 2019 | $3,911 | $139,104 | $12,600 | $126,504 |
| 2018 | $3,841 | $132,971 | $12,600 | $120,371 |
| 2017 | $3,750 | $127,964 | $12,600 | $115,364 |
| 2016 | $3,516 | $124,954 | $10,000 | $114,954 |
| 2015 | $305 | $10,000 | $10,000 | $0 |
| 2014 | $80 | $2,680 | $2,680 | $0 |
| 2013 | -- | $1,960 | $1,960 | $0 |
Source: Public Records
Map
Nearby Homes
- 120 Springs Creek Dr
- 120 Hidden Falls Ct
- 224 Hollis St
- 0 Hawkins Academy Rd Unit 10561655
- 170 Fairplay St
- 305 Fairplay St
- 5761 W Dixie Hwy
- 5521 Atlanta Hwy
- 2791 Old Mill Rd
- 294 Tuscany Dr
- 0 W Dixie Hwy Unit 10499573
- 4610 Atlanta Hwy
- 1000 Amber Stapp Studdard Rd
- 1041 Cooper Ln
- 25 Browning Shoals Rd
- 1150 Harris Hollis Ln
- 2535B Willow Grove Ln
- 539 Knox Cir
- 4923 Hawkins Academy Rd
- 725 Amber Lakes Ct
- 135 Springs Creek Dr
- 130 Spring Creek Dr Unit 18
- 130 Springs Creek Dr Unit 18
- 130 Springs Creek Dr
- 131 Spring Creek Dr
- 131 Spring Creek Dr Unit 20
- 131 Springs Creek Dr Unit 20
- 131 Springs Creek Dr
- 131 Springs Creek Dr Unit 20
- 120 Springs Creek Dr Unit 17
- 121 Spring Creek Dr
- 121 Spring Creek Dr Unit 21
- 211 Hidden Springs Dr
- 121 Springs Creek Dr Unit 21
- 121 Springs Creek Dr
- 201 Hidden Springs Dr Unit 16
- 120 Spring Creek Dr Unit 17
- 221 Hidden Springs Dr Unit 14
- 180 Shoals Creek Ln
- 231 Hidden Springs Dr
Your Personal Tour Guide
Ask me questions while you tour the home.