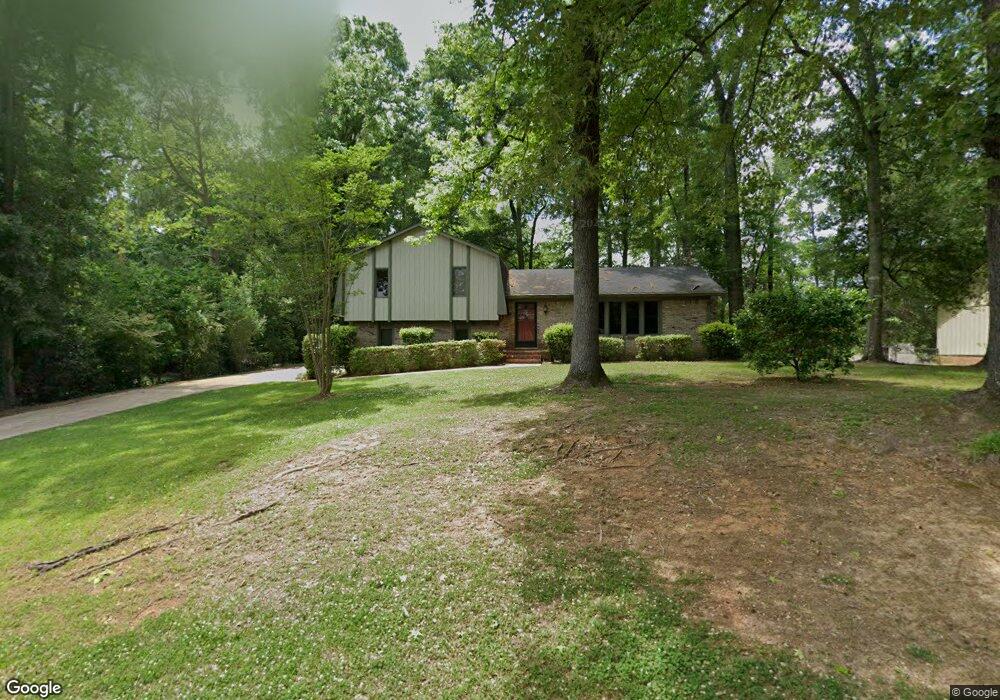
136 Maple St Maylene, AL 35114
Estimated Value: $271,415 - $282,000
About This Home
This home is located at 136 Maple St, Maylene, AL 35114 and is currently estimated at $275,604, approximately $147 per square foot. 136 Maple St is a home located in Shelby County with nearby schools including Thompson Intermediate School, Thompson Middle School, and Thompson High School.
Ownership History
We collect this data history from publicly available records. To have your information removed, we recommend requesting removal directly through your county’s website.
Purchase Details
Home Financials for this Owner
Home Financials are based on the most recent Mortgage that was taken out on this home.Purchase Details
Home Financials for this Owner
Home Financials are based on the most recent Mortgage that was taken out on this home.Purchase Details
Home Financials for this Owner
Home Financials are based on the most recent Mortgage that was taken out on this home.Home Values in the Area
Average Home Value in this Area
Purchase History
We collect this data history from publicly available records. To have your information removed, we recommend requesting removal directly through your county’s website.
| Date | Buyer | Sale Price | Title Company |
|---|---|---|---|
| -- | None Available | ||
| $128,800 | -- | ||
| $105,000 | -- |
Mortgage History
We collect this data history from publicly available records. To have your information removed, we recommend requesting removal directly through your county’s website.
| Date | Status | Borrower | Loan Amount |
|---|---|---|---|
| Closed | $109,600 | ||
| Previous Owner | $128,800 | ||
| Previous Owner | $104,350 |
Tax History
We collect this data history from publicly available records. To have your information removed, we recommend requesting removal directly through your county’s website.
| Year | Tax Paid | Tax Assessment Tax Assessment Total Assessment is a certain percentage of the fair market value that is determined by local assessors to be the total taxable value of land and additions on the property. | Land | Improvement |
|---|---|---|---|---|
| 2025 | $1,299 | $24,060 | $0 | $0 |
| 2024 | $1,274 | $23,600 | $0 | $0 |
| 2023 | $1,144 | $21,940 | $0 | $0 |
| 2022 | $1,060 | $20,380 | $0 | $0 |
| 2021 | $945 | $18,260 | $0 | $0 |
| 2020 | $879 | $0 | $0 | $0 |
| 2019 | $825 | $16,040 | $0 | $0 |
| 2017 | $701 | $13,740 | $0 | $0 |
| 2015 | $680 | $13,360 | $0 | $0 |
| 2014 | $663 | $13,040 | $0 | $0 |
Map
- 107 Redwood Dr
- 105 Maple St
- 216 Redwood Dr
- 1131 Eagle Dr
- 4 Acres Woodland Hills
- 428 Sterling Park Cir
- 282 Kensington Ln
- 408 Cedar Grove Ln
- 108 Victoria Station
- 124 Cedar Grove Pkwy
- 100 Victoria Station
- 755 Crider Rd
- 248 Kensington Ln
- 413 Cornwall Dr
- 257 Lacey Ave
- 204 Cedar Grove Pkwy
- 549 Ramsgate Dr
- 545 Ramsgate Dr
- 544 Ramsgate Dr
- 236 Queens Gate
Ask me questions while you tour the home.