13613 Craig Ave Grandview, MO 64030
Estimated Value: $179,000 - $220,042
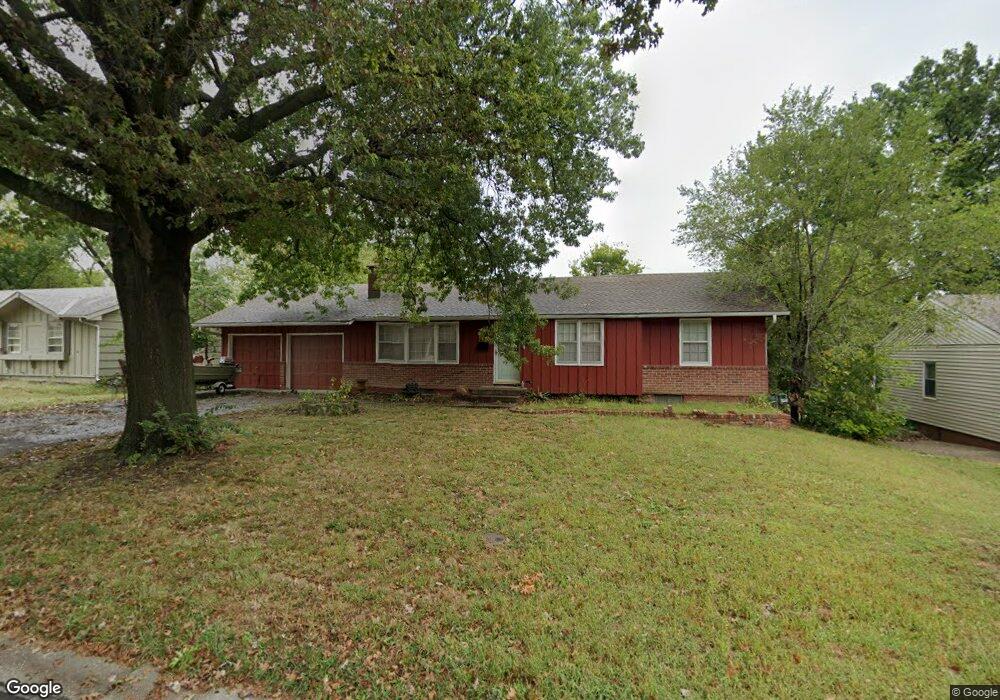
About This Home
This home is located at 13613 Craig Ave, Grandview, MO 64030 and is currently estimated at $206,761, approximately $191 per square foot. 13613 Craig Ave is a home located in Jackson County with nearby schools including Meadowmere Elementary School, Grandview Middle, and Grandview High School.
Ownership History
We collect this data history from publicly available records. To have your information removed, we recommend requesting removal directly through your county’s website.
Purchase Details
Home Financials for this Owner
Home Financials are based on the most recent Mortgage that was taken out on this home.Purchase Details
Home Financials for this Owner
Home Financials are based on the most recent Mortgage that was taken out on this home.Purchase Details
Home Values in the Area
Average Home Value in this Area
Purchase History
We collect this data history from publicly available records. To have your information removed, we recommend requesting removal directly through your county’s website.
| Date | Buyer | Sale Price | Title Company |
|---|---|---|---|
| -- | None Available | ||
| -- | Missouri Secured Title | ||
| -- | None Available |
Mortgage History
We collect this data history from publicly available records. To have your information removed, we recommend requesting removal directly through your county’s website.
| Date | Status | Borrower | Loan Amount |
|---|---|---|---|
| Open | $53,000 | ||
| Previous Owner | $65,000 |
Tax History
We collect this data history from publicly available records. To have your information removed, we recommend requesting removal directly through your county’s website.
| Year | Tax Paid | Tax Assessment Tax Assessment Total Assessment is a certain percentage of the fair market value that is determined by local assessors to be the total taxable value of land and additions on the property. | Land | Improvement |
|---|---|---|---|---|
| 2025 | $2,216 | $25,629 | $5,073 | $20,556 |
| 2024 | $2,178 | $27,250 | $3,703 | $23,547 |
| 2023 | $2,178 | $27,250 | $3,686 | $23,564 |
| 2022 | $1,664 | $19,380 | $4,313 | $15,067 |
| 2021 | $1,662 | $19,380 | $4,313 | $15,067 |
| 2020 | $1,398 | $17,257 | $4,313 | $12,944 |
| 2019 | $1,348 | $17,257 | $4,313 | $12,944 |
| 2018 | $1,052 | $12,528 | $2,698 | $9,830 |
| 2017 | $1,052 | $12,528 | $2,698 | $9,830 |
| 2016 | $1,051 | $12,264 | $3,052 | $9,212 |
| 2014 | $1,045 | $12,024 | $2,993 | $9,031 |
Map
- 13509 Belmeade Ave
- 6705 E 138th Terrace
- 13420 Belmeade Ave
- 13624 Parker Ave
- 13227 Bennington Ave
- 6104 E 136th St
- 7403 E 134th Terrace
- 13419 Parker Ave
- 6206 E 140th Terrace
- 13205 Bristol Ave
- 13408 Parker Ave
- 13318 Parker Ave
- 7601 E 134th Terrace
- 14002 Ballantrae Dr
- 14025 Ballantrae Dr
- 14051 Dunbar Ct
- 1926 High Grove Rd
- 7310 Highgrove Rd
- 1502 E 135th St
- 13309 Park Hills Dr
- 13616 Winchester Ave
- 13620 Winchester Ave
- 13612 Winchester Ave
- 13617 Winchester Ave
- 13613 Winchester Ave
- 13621 Winchester Ave
- 13624 Winchester Ave
- 13608 Winchester Ave
- 13617 Craig Ave
- 13609 Winchester Ave
- 13625 Winchester Ave
- 13621 Craig Ave
- 13628 Winchester Ave
- 13625 Craig Ave
- 13609 Craig Ave
- 13629 Winchester Ave
- 13629 Craig Ave
- 6805 E 136th St
- 13630 Winchester Ave
- 6801 E 136th St
Ask me questions while you tour the home.