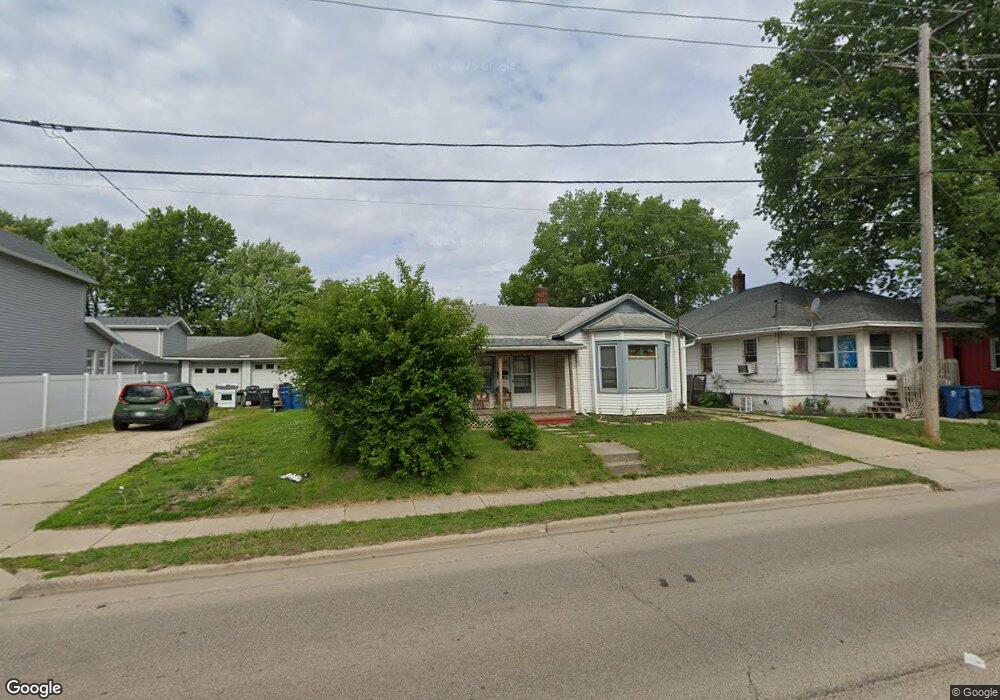
1364 N Division St Morris, IL 60450
Estimated Value: $244,000 - $253,016
Studio
--
Bath
1,024
Sq Ft
$243/Sq Ft
Est. Value
About This Home
This home is located at 1364 N Division St, Morris, IL 60450 and is currently estimated at $249,339, approximately $243 per square foot. 1364 N Division St is a home with nearby schools including White Oak Elementary School, Shabbona Middle School, and Morris Community High School.
Ownership History
Date
Name
Owned For
Owner Type
Purchase Details
Closed on
May 28, 2024
Sold by
Benson James A and Benson Ruth Ann
Bought by
Benson James A and Benson Ruth Ann
Current Estimated Value
Purchase Details
Closed on
Sep 7, 2017
Sold by
Benson James A and Benson Ruth Ann
Bought by
Wilkison Phillip and Wilkison Julie
Create a Home Valuation Report for This Property
The Home Valuation Report is an in-depth analysis detailing your home's value as well as a comparison with similar homes in the area
Purchase History
| Date | Buyer | Sale Price | Title Company |
|---|---|---|---|
| Benson James A | -- | None Listed On Document | |
| Wilkison Phillip | $37,000 | -- |
Source: Public Records
Tax History
| Year | Tax Paid | Tax Assessment Tax Assessment Total Assessment is a certain percentage of the fair market value that is determined by local assessors to be the total taxable value of land and additions on the property. | Land | Improvement |
|---|---|---|---|---|
| 2024 | $6,698 | $85,588 | $23,980 | $61,608 |
| 2023 | $6,308 | $80,606 | $22,584 | $58,022 |
| 2022 | $5,819 | $74,346 | $20,830 | $53,516 |
| 2021 | $5,580 | $70,310 | $19,699 | $50,611 |
| 2020 | $5,517 | $68,515 | $19,196 | $49,319 |
| 2019 | $5,200 | $64,943 | $18,195 | $46,748 |
| 2018 | $5,120 | $63,683 | $17,842 | $45,841 |
| 2017 | $4,819 | $60,335 | $16,904 | $43,431 |
Source: Public Records
Map
Nearby Homes
- 409 Mckinley St
- 1 By Railroad Track
- 245 Robinson Dr
- Lot 3 Heron Lake Ct
- 329 Robinson Dr
- Lot 1 W Commercial St
- 1220 Liberty St
- 1224 Grant St
- 1595 W Us Rte 6
- 1.88 Acres Rd
- LOT 5 Henry St
- 1112 & 1112 1/2 Butler St
- 1368 Heritage Dr
- 1238 Wauponsee St
- 1218 Gladys Ave
- 523 Bedford Rd
- 511 Armstrong St
- 815 Kiersted St
- 1301 Union St
- 816 2nd Ave
- 1360 N Division St
- 101 E Waverly St
- 101 E Waverly St
- 1367 N Division St
- 1373 N Division St
- 115 E Waverly St
- 1342 N Division St
- 1357 N Division St
- 1336 N Division St
- 1409 N Division St
- 122 Robinson Dr
- 114 Robinson Dr
- 126 Robinson Dr
- 130 Robinson Dr
- 110 Robinson Dr
- 106 Robinson Dr
- 105 E Waverly St
- 1330 N Division St
- 1421 N Division St
- 138 Robinson Dr
Your Personal Tour Guide
Ask me questions while you tour the home.