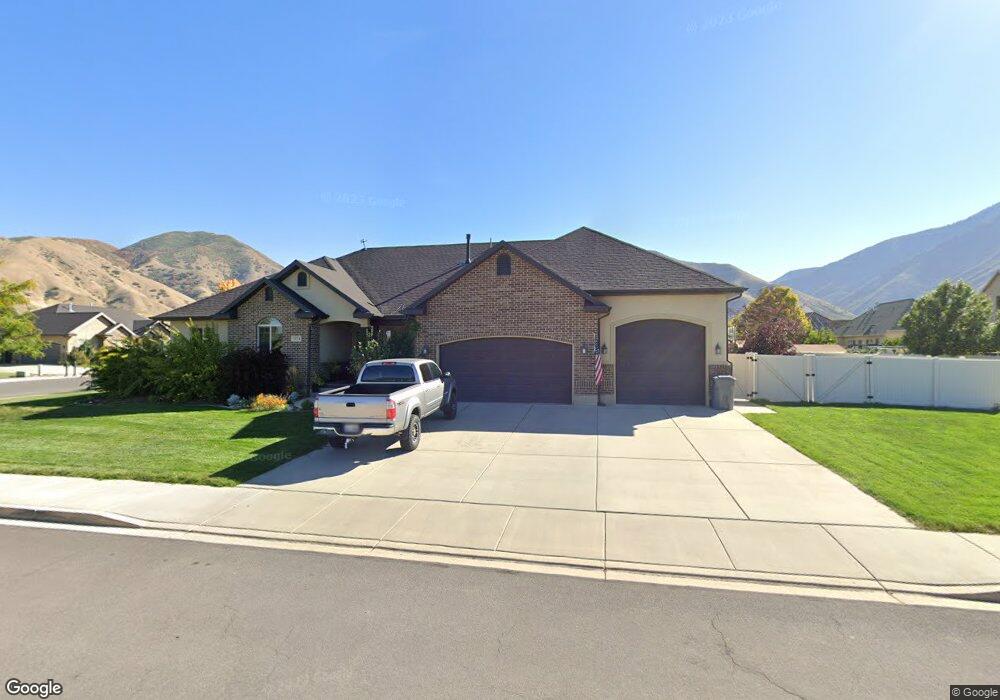
1374 N 200 E Mapleton, UT 84664
Estimated Value: $672,000 - $811,081
3
Beds
3
Baths
1,952
Sq Ft
$389/Sq Ft
Est. Value
About This Home
This home is located at 1374 N 200 E, Mapleton, UT 84664 and is currently estimated at $758,770, approximately $388 per square foot. 1374 N 200 E is a home with nearby schools including Hobble Creek School, Mapleton Junior High School, and Maple Mountain High School.
Ownership History
Date
Name
Owned For
Owner Type
Purchase Details
Closed on
Sep 24, 2009
Sold by
Dean Marvin and Dean Tabrina
Bought by
Dean Marvin and Dean Tabrina
Current Estimated Value
Home Financials for this Owner
Home Financials are based on the most recent Mortgage that was taken out on this home.
Original Mortgage
$237,000
Outstanding Balance
$155,469
Interest Rate
5.25%
Mortgage Type
New Conventional
Estimated Equity
$603,301
Purchase Details
Closed on
Mar 9, 2009
Sold by
Holmes John J and Holmes Frances A
Bought by
Dean Marvin and Dean Tabrina
Purchase Details
Closed on
Nov 27, 2004
Sold by
Rlsh Holdings Lc
Bought by
Holmes John J and Holmes France A
Home Financials for this Owner
Home Financials are based on the most recent Mortgage that was taken out on this home.
Original Mortgage
$76,000
Interest Rate
5.65%
Mortgage Type
Seller Take Back
Create a Home Valuation Report for This Property
The Home Valuation Report is an in-depth analysis detailing your home's value as well as a comparison with similar homes in the area
Home Values in the Area
Average Home Value in this Area
Purchase History
| Date | Buyer | Sale Price | Title Company |
|---|---|---|---|
| Dean Marvin | -- | Provo Land Title Company | |
| Dean Marvin | -- | Eagle Pointe Title Insuranc | |
| Holmes John J | -- | Horizon Title Insurance |
Source: Public Records
Mortgage History
| Date | Status | Borrower | Loan Amount |
|---|---|---|---|
| Open | Dean Marvin | $237,000 | |
| Previous Owner | Holmes John J | $76,000 |
Source: Public Records
Tax History
| Year | Tax Paid | Tax Assessment Tax Assessment Total Assessment is a certain percentage of the fair market value that is determined by local assessors to be the total taxable value of land and additions on the property. | Land | Improvement |
|---|---|---|---|---|
| 2025 | $3,483 | $388,300 | -- | -- |
| 2024 | $3,483 | $341,220 | $0 | $0 |
| 2023 | $3,596 | $354,530 | $0 | $0 |
| 2022 | $3,787 | $369,160 | $0 | $0 |
| 2021 | $3,170 | $474,400 | $181,700 | $292,700 |
| 2020 | $3,133 | $453,500 | $160,800 | $292,700 |
| 2019 | $2,767 | $408,800 | $154,300 | $254,500 |
| 2018 | $2,692 | $378,600 | $130,000 | $248,600 |
| 2017 | $2,729 | $203,720 | $0 | $0 |
| 2016 | $2,685 | $199,265 | $0 | $0 |
| 2015 | $2,611 | $192,555 | $0 | $0 |
| 2014 | $2,432 | $176,165 | $0 | $0 |
Source: Public Records
Map
Nearby Homes
- 1350 N Main St
- 435 E 1000 N
- 1567 N 600 E Unit 26
- 897 N Main St
- 145 W Carnesecca Ct
- 594 E 1000 N
- 265 E 600 N
- 1697 N 500 W
- 775 N 800 E
- 1096 N 1000 E
- 84 E 530 N
- 598 W 1600 N
- 1096 Valley Sage Dr
- 1092 Valley Sage Dr
- 1839 River Bottom Rd
- 667 N 550 W
- 829 S 2200 E
- 1447 N 1350 St E Unit 5
- 1577 N 1350 St E Unit 1
- 1477 N 1350 St E Unit 4
Your Personal Tour Guide
Ask me questions while you tour the home.