S
Seller's Agent in 2012
Seth Campbell Realty Group
Keller Williams Boston MetroWest

Estimated Value: $568,000 - $770,251
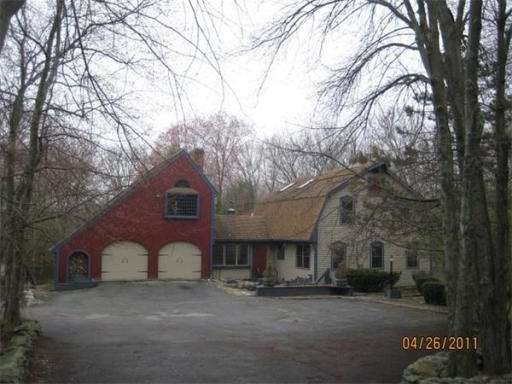
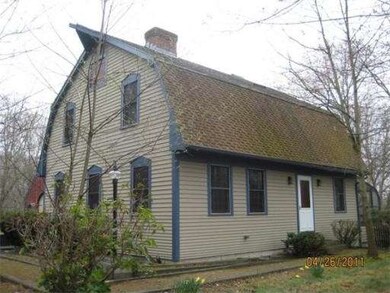
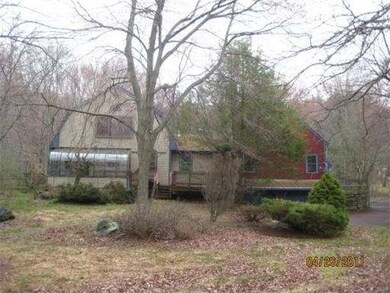
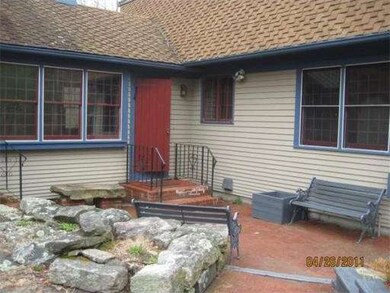
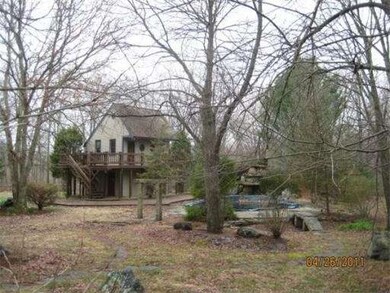
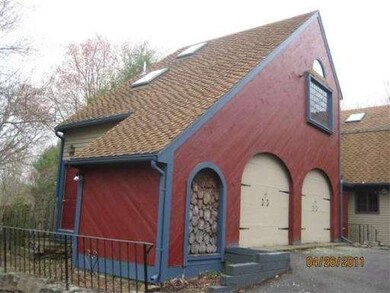
3 BR Gambrel w/ attached 2 car garage with loft area above. IG Pool (condition unknown) Pool House with full bath. A mini estate on a 5+ acre private lot. House appears to be in good condition with hardwood floors in many rooms. BricK fireplaced LR. This is a FannieMae HomePath property.Purchase this property for as little as 3% down! This property is approved for HomePath Renovation Mortgage Financing. Agents: Fannie Mae requires that all offers be submitted on their website. See firm remarks.
Last Agent to Sell the Property
Seth Campbell Realty Group
Keller Williams Boston MetroWest Listed on: 12/01/2011
Home Type
Single Family
Year Built
1984
Lot Details
5.28 Acres
We collect this data history from publicly available records. To have your information removed, we recommend requesting removal directly through your county’s website.
We collect this data history from publicly available records. To have your information removed, we recommend requesting removal directly through your county’s website.
| Date | Buyer | Sale Price | Title Company |
|---|---|---|---|
| $280,000 | -- | ||
| $280,000 | -- | ||
| $280,000 | -- | ||
| $222,000 | -- | ||
| $222,000 | -- | ||
| $222,000 | -- | ||
| $339,352 | -- | ||
| $339,352 | -- | ||
| $339,352 | -- |
We collect this data history from publicly available records. To have your information removed, we recommend requesting removal directly through your county’s website.
| Date | Status | Borrower | Loan Amount |
|---|---|---|---|
| Open | $285,000 | ||
| Closed | $280,000 |
We collect this data history from publicly available records. To have your information removed, we recommend requesting removal directly through your county’s website.
| Date | Event | Price | List to Sale | Price per Sq Ft |
|---|---|---|---|---|
| 05/15/2012 05/15/12 | Sold | $222,000 | -14.6% | $89 / Sq Ft |
| 05/01/2012 05/01/12 | Pending | -- | -- | -- |
| 02/21/2012 02/21/12 | Price Changed | $259,900 | -5.5% | $104 / Sq Ft |
| 02/02/2012 02/02/12 | Price Changed | $274,900 | -8.3% | $110 / Sq Ft |
| 01/18/2012 01/18/12 | Price Changed | $299,900 | +3.4% | $120 / Sq Ft |
| 01/17/2012 01/17/12 | Price Changed | $289,900 | -9.4% | $116 / Sq Ft |
| 01/06/2012 01/06/12 | Price Changed | $319,900 | -9.9% | $128 / Sq Ft |
| 12/01/2011 12/01/11 | For Sale | $354,900 | -- | $142 / Sq Ft |
We collect this data history from publicly available records. To have your information removed, we recommend requesting removal directly through your county’s website.
| Year | Tax Paid | Tax Assessment Tax Assessment Total Assessment is a certain percentage of the fair market value that is determined by local assessors to be the total taxable value of land and additions on the property. | Land | Improvement |
|---|---|---|---|---|
| 2025 | $9,227 | $782,600 | $185,600 | $597,000 |
| 2024 | $8,695 | $719,200 | $185,600 | $533,600 |
| 2023 | $8,664 | $668,500 | $185,600 | $482,900 |
| 2022 | $8,350 | $606,400 | $149,600 | $456,800 |
| 2021 | $8,129 | $561,000 | $142,500 | $418,500 |
| 2020 | $7,519 | $543,300 | $142,500 | $400,800 |
| 2019 | $6,741 | $519,700 | $142,500 | $377,200 |
| 2018 | $1,910 | $499,900 | $136,900 | $363,000 |
| 2017 | $6,406 | $473,500 | $136,900 | $336,600 |
| 2016 | $6,204 | $451,200 | $125,600 | $325,600 |
| 2015 | $6,037 | $451,200 | $125,600 | $325,600 |
| 2014 | $5,983 | $451,200 | $125,600 | $325,600 |
S
Seller's Agent in 2012
Seth Campbell Realty Group
Keller Williams Boston MetroWest

Buyer's Agent in 2012
Tracy Sharkey
Sharkey Realty
(774) 280-1505
18 Total Sales
Source: MLS Property Information Network (MLS PIN)
MLS Number: 71315788
APN: NBRI-000028-000039
Disclaimer: Certain information contained herein is derived from information provided by parties other than Homes.com. All information provided is deemed reliable, but is not guaranteed to be accurate and should be independently verified.
![]() The property listing data and information, or the Images, set forth herein were provided to MLS Property Information Network, Inc. from third party sources, including sellers, lessors and public records, and were compiled by MLS Property Information Network, Inc. The property listing data and information, and the Images, are for the personal, non-commercial use of consumers having a good faith interest in purchasing or leasing listed properties of the type displayed to them and may not be used for any purpose other than to identify prospective properties which such consumers may have a good faith interest in purchasing or leasing. MLS Property Information Network, Inc. and its subscribers disclaim any and all representations and warranties as to the accuracy of the property listing data and information, or as to the accuracy of any of the Images, set forth herein.
The property listing data and information, or the Images, set forth herein were provided to MLS Property Information Network, Inc. from third party sources, including sellers, lessors and public records, and were compiled by MLS Property Information Network, Inc. The property listing data and information, and the Images, are for the personal, non-commercial use of consumers having a good faith interest in purchasing or leasing listed properties of the type displayed to them and may not be used for any purpose other than to identify prospective properties which such consumers may have a good faith interest in purchasing or leasing. MLS Property Information Network, Inc. and its subscribers disclaim any and all representations and warranties as to the accuracy of the property listing data and information, or as to the accuracy of any of the Images, set forth herein.
Ask me questions while you tour the home.