
Landlord's Agent in 2023
HUONG NGUYEN
Virtual Properties Realty.BIZ
(404) 447-8888
1 in this area
15 Total Sales
Estimated Value: $597,820 - $638,000
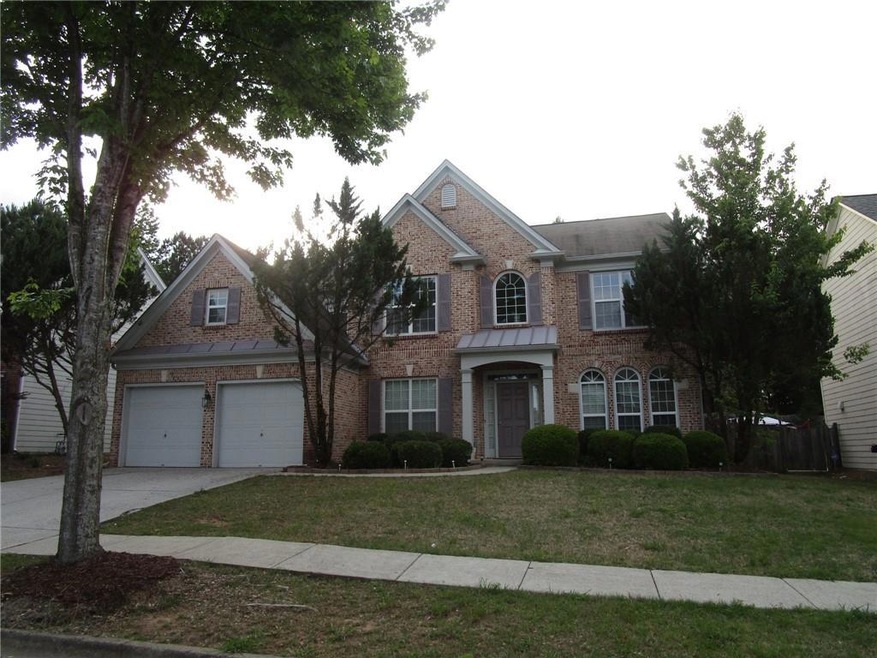
House located in GA high ranking schools, ready for move in !. Beautiful brick front.Spacious,open floor plan 5 bdrm & 3 full bath. 2 story foyer & family rm. Formal living & dining rm. Kitchen comes w. hardwood floor, many cabinets, big island, breakfast area view to keeping rm,double side fireplace. Family room w. wall of windows.Master suite has tray ceilings, double vanity, separated tub / showers, huge walk-in closet. Guest bedroom on main has it's own bath. Level driveway. Fence for private backyard. Amenities community. Minutes to Suwanee town and Parks. Application fee $55 / adult.
Last Agent to Rent the Property
Virtual Properties Realty. Biz License #208058 Listed on: 05/14/2023
We collect this data history from publicly available records. To have your information removed, we recommend requesting removal directly through your county’s website.
We collect this data history from publicly available records. To have your information removed, we recommend requesting removal directly through your county’s website.
| Date | Buyer | Sale Price | Title Company |
|---|---|---|---|
| $310,000 | -- | ||
| $242,500 | -- |
We collect this data history from publicly available records. To have your information removed, we recommend requesting removal directly through your county’s website.
| Date | Status | Borrower | Loan Amount |
|---|---|---|---|
| Open | $232,500 | ||
| Previous Owner | $230,289 |
We collect this data history from publicly available records. To have your information removed, we recommend requesting removal directly through your county’s website.
| Date | Event | Price | List to Sale | Price per Sq Ft | Prior Sale |
|---|---|---|---|---|---|
| 06/02/2023 06/02/23 | Rented | $2,700 | 0.0% | -- | |
| 05/26/2023 05/26/23 | Under Contract | -- | -- | -- | |
| 05/14/2023 05/14/23 | For Rent | $2,700 | +12.5% | -- | |
| 09/11/2021 09/11/21 | Rented | $2,400 | 0.0% | -- | |
| 08/17/2021 08/17/21 | For Rent | $2,400 | +14.3% | -- | |
| 03/29/2019 03/29/19 | Rented | $2,100 | 0.0% | -- | |
| 11/27/2018 11/27/18 | For Rent | $2,100 | 0.0% | -- | |
| 11/13/2018 11/13/18 | Sold | $310,000 | 0.0% | $104 / Sq Ft | View Prior Sale |
| 10/06/2018 10/06/18 | Pending | -- | -- | -- | |
| 10/04/2018 10/04/18 | For Sale | $309,900 | 0.0% | $104 / Sq Ft | |
| 01/13/2016 01/13/16 | Rented | $1,800 | 0.0% | -- | |
| 12/21/2015 12/21/15 | For Rent | $1,800 | +5.9% | -- | |
| 11/01/2014 11/01/14 | Rented | $1,700 | 0.0% | -- | |
| 11/01/2014 11/01/14 | For Rent | $1,700 | +9.7% | -- | |
| 05/15/2013 05/15/13 | Rented | $1,550 | 0.0% | -- | |
| 04/15/2013 04/15/13 | Under Contract | -- | -- | -- | |
| 03/21/2013 03/21/13 | For Rent | $1,550 | -- | -- |
We collect this data history from publicly available records. To have your information removed, we recommend requesting removal directly through your county’s website.
| Year | Tax Paid | Tax Assessment Tax Assessment Total Assessment is a certain percentage of the fair market value that is determined by local assessors to be the total taxable value of land and additions on the property. | Land | Improvement |
|---|---|---|---|---|
| 2025 | $8,328 | $227,160 | $38,000 | $189,160 |
| 2024 | $8,271 | $223,160 | $40,400 | $182,760 |
| 2023 | $8,271 | $223,160 | $40,400 | $182,760 |
| 2022 | $6,728 | $180,320 | $38,400 | $141,920 |
| 2021 | $5,187 | $134,680 | $30,400 | $104,280 |
| 2020 | $5,001 | $128,720 | $27,600 | $101,120 |
| 2019 | $4,651 | $124,000 | $27,600 | $96,400 |
| 2018 | $4,483 | $119,000 | $27,600 | $91,400 |
| 2016 | $3,927 | $102,680 | $23,600 | $79,080 |
| 2015 | $3,659 | $93,880 | $18,040 | $75,840 |
| 2014 | $3,441 | $87,200 | $16,000 | $71,200 |
Landlord's Agent in 2023
HUONG NGUYEN
Virtual Properties Realty.BIZ
(404) 447-8888
1 in this area
15 Total Sales
S
Tenant's Agent in 2023
Soyoul Lee
GreenPoint Realty, LLC
(404) 509-3656
7 in this area
22 Total Sales
N
Buyer's Agent in 2021
NON-MLS NMLS
Non FMLS Member
Seller's Agent in 2018
Anwar Ghaswala
Chapman Hall Realtors
(770) 912-2676
1 in this area
10 Total Sales
A
Seller Co-Listing Agent in 2016
Amirali Ghaswala
Offerpad Brokerage, LLC.
D
Buyer's Agent in 2016
DIANE REGAN
NOT A VALID MEMBER
Source: First Multiple Listing Service (FMLS)
MLS Number: 7218031
APN: 7-288-266
![]() Listings identified with the FMLS IDX logo come from FMLS and are held by brokerage firms other than the owner of this website. The listing brokerage is identified in any listing details. Information is deemed reliable but is not guaranteed. If you believe any FMLS listing contains material that infringes your copyrighted work please visit www.fmls.com/dmca to review our DMCA policy and learn how to submit a takedown request. © 2026 First Multiple Listing Service, Inc.
Listings identified with the FMLS IDX logo come from FMLS and are held by brokerage firms other than the owner of this website. The listing brokerage is identified in any listing details. Information is deemed reliable but is not guaranteed. If you believe any FMLS listing contains material that infringes your copyrighted work please visit www.fmls.com/dmca to review our DMCA policy and learn how to submit a takedown request. © 2026 First Multiple Listing Service, Inc.
Disclaimer: Certain information contained herein is derived from information provided by parties other than Homes.com. All information provided is deemed reliable, but is not guaranteed to be accurate and should be independently verified.
Ask me questions while you tour the home.