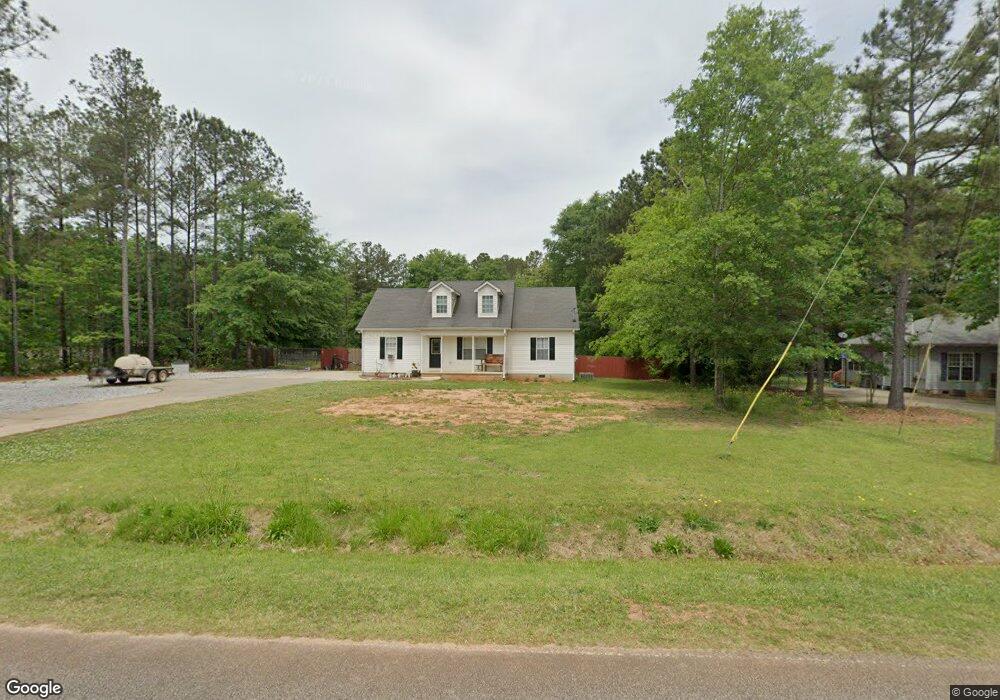
138 Ridgeway Rd Milner, GA 30257
Estimated Value: $233,180 - $283,000
3
Beds
2
Baths
1,196
Sq Ft
$210/Sq Ft
Est. Value
About This Home
This home is located at 138 Ridgeway Rd, Milner, GA 30257 and is currently estimated at $251,545, approximately $210 per square foot. 138 Ridgeway Rd is a home with nearby schools including Lamar County Primary School, Lamar County Elementary School, and Lamar County Middle School.
Ownership History
Date
Name
Owned For
Owner Type
Purchase Details
Closed on
Mar 31, 2026
Sold by
Grammer Wilbur
Bought by
Arrington Gary and Arrington Haley
Current Estimated Value
Home Financials for this Owner
Home Financials are based on the most recent Mortgage that was taken out on this home.
Original Mortgage
$103,000
Outstanding Balance
$102,897
Interest Rate
6%
Mortgage Type
New Conventional
Estimated Equity
$148,648
Purchase Details
Closed on
Jan 28, 2016
Sold by
Gasaway Whitney R Grammer
Bought by
Grammer Wilbur Ray
Purchase Details
Closed on
Jan 25, 2016
Sold by
Grammer Rebecca R
Bought by
Gasaway Whitney R and Gasaway Grammer
Purchase Details
Closed on
Apr 20, 2004
Sold by
Mobley Alan
Bought by
Grammer Whitney
Create a Home Valuation Report for This Property
The Home Valuation Report is an in-depth analysis detailing your home's value as well as a comparison with similar homes in the area
Purchase History
We collect this data history from publicly available records. To have your information removed, we recommend requesting removal directly through your county’s website.
| Date | Buyer | Sale Price | Title Company |
|---|---|---|---|
| Arrington Gary | $119,900 | -- | |
| Grammer Wilbur Ray | $84,528 | -- | |
| Gasaway Whitney R | -- | -- | |
| Grammer Whitney | $106,500 | -- |
Source: Public Records
Mortgage History
We collect this data history from publicly available records. To have your information removed, we recommend requesting removal directly through your county’s website.
| Date | Status | Borrower | Loan Amount |
|---|---|---|---|
| Open | Arrington Gary | $103,000 |
Source: Public Records
Tax History
| Year | Tax Paid | Tax Assessment Tax Assessment Total Assessment is a certain percentage of the fair market value that is determined by local assessors to be the total taxable value of land and additions on the property. | Land | Improvement |
|---|---|---|---|---|
| 2025 | $1,623 | $73,918 | $7,737 | $66,181 |
| 2024 | $1,529 | $61,620 | $7,737 | $53,883 |
| 2023 | $1,854 | $69,042 | $6,000 | $63,042 |
| 2022 | $1,754 | $65,438 | $6,000 | $59,438 |
| 2021 | $1,551 | $53,504 | $6,000 | $47,504 |
| 2020 | $1,558 | $51,124 | $6,000 | $45,124 |
| 2019 | $1,206 | $39,898 | $6,000 | $33,898 |
| 2018 | $1,158 | $39,898 | $6,000 | $33,898 |
| 2017 | $1,152 | $39,898 | $6,000 | $33,898 |
| 2016 | $1,153 | $39,898 | $6,000 | $33,898 |
| 2015 | $1,147 | $39,898 | $6,000 | $33,898 |
| 2014 | $1,112 | $39,898 | $6,000 | $33,898 |
| 2013 | -- | $41,897 | $8,000 | $33,897 |
Source: Public Records
Map
Nearby Homes
- 118 Ridgeway Rd
- 454 Tom Bell Rd
- 402 Tom Bell Rd
- 151 Evans Rd
- 340 Tom Bell Rd
- 0 Savannah Way Unit 10712963
- 171 Hoyt Rd
- 179 Hoyt Rd
- 120 Mill Pond Ct
- 787 Silver Dollar Rd
- 104 Savannah Way
- 112 Liberty Hill St
- 654, LOT 66, 67 Liberty Hill Rd
- 654 Liberty Hill Rd
- 132 Benfranklin Ct
- O LOT 4 Main St
- 618 Liberty Hill Rd
- 105 Zebulon St
- 117 Zebulon St
- 206 McKneely Rd
Your Personal Tour Guide
Ask me questions while you tour the home.