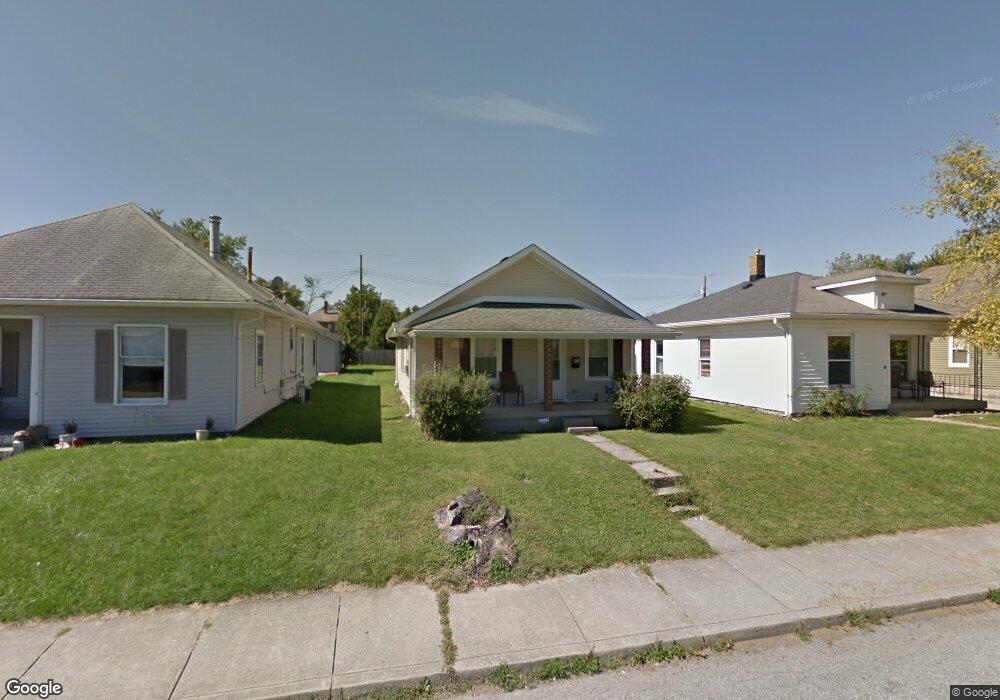
138 S 3rd Ave Beech Grove, IN 46107
Estimated Value: $150,000 - $156,000
2
Beds
1
Bath
936
Sq Ft
$163/Sq Ft
Est. Value
About This Home
This home is located at 138 S 3rd Ave, Beech Grove, IN 46107 and is currently estimated at $152,445, approximately $162 per square foot. 138 S 3rd Ave is a home located in Marion County with nearby schools including Hornet Park Elementary School, Central Elementary School, and South Grove Intermediate School.
Ownership History
Date
Name
Owned For
Owner Type
Purchase Details
Closed on
Jun 18, 2021
Sold by
Dicus Jessica L
Bought by
Wilhite Charles
Current Estimated Value
Home Financials for this Owner
Home Financials are based on the most recent Mortgage that was taken out on this home.
Original Mortgage
$84,000
Outstanding Balance
$75,218
Interest Rate
2.9%
Mortgage Type
New Conventional
Estimated Equity
$77,227
Purchase Details
Closed on
May 5, 2017
Sold by
Jessica L Dicus
Bought by
Dicus Jessica L
Purchase Details
Closed on
Jul 10, 2013
Sold by
Laswell Constance E
Bought by
Dicus Gary L
Purchase Details
Closed on
Sep 12, 2012
Sold by
Stephens Connie Lynn
Bought by
Laswell Constance E
Purchase Details
Closed on
Sep 7, 2012
Sold by
Stephens Joshua Carter and Stephens Joshua C
Bought by
Stephens Connie Lynn
Purchase Details
Closed on
Apr 8, 2004
Sold by
Carter Joel K
Bought by
Stephens Joshua C
Create a Home Valuation Report for This Property
The Home Valuation Report is an in-depth analysis detailing your home's value as well as a comparison with similar homes in the area
Home Values in the Area
Average Home Value in this Area
Purchase History
We collect this data history from publicly available records. To have your information removed, we recommend requesting removal directly through your county’s website.
| Date | Buyer | Sale Price | Title Company |
|---|---|---|---|
| Wilhite Charles | -- | Chicago Title | |
| Dicus Jessica L | -- | -- | |
| Dicus Gary L | -- | -- | |
| Laswell Constance E | -- | None Available | |
| Stephens Connie Lynn | -- | None Available | |
| Stephens Joshua C | -- | None Available |
Source: Public Records
Mortgage History
We collect this data history from publicly available records. To have your information removed, we recommend requesting removal directly through your county’s website.
| Date | Status | Borrower | Loan Amount |
|---|---|---|---|
| Open | Wilhite Charles | $84,000 |
Source: Public Records
Tax History
| Year | Tax Paid | Tax Assessment Tax Assessment Total Assessment is a certain percentage of the fair market value that is determined by local assessors to be the total taxable value of land and additions on the property. | Land | Improvement |
|---|---|---|---|---|
| 2025 | $1,427 | $129,100 | $17,000 | $112,100 |
| 2024 | $1,427 | $112,300 | $17,000 | $95,300 |
| 2023 | $1,427 | $112,300 | $17,000 | $95,300 |
| 2022 | $1,296 | $100,900 | $17,000 | $83,900 |
| 2021 | $671 | $63,900 | $17,000 | $46,900 |
| 2020 | $1,590 | $61,100 | $17,000 | $44,100 |
| 2019 | $1,412 | $56,300 | $14,000 | $42,300 |
| 2018 | $1,252 | $51,700 | $14,000 | $37,700 |
| 2017 | $1,306 | $52,200 | $14,000 | $38,200 |
| 2016 | $1,112 | $44,900 | $14,000 | $30,900 |
| 2014 | $1,076 | $45,800 | $14,000 | $31,800 |
| 2013 | $1,130 | $45,800 | $14,000 | $31,800 |
Source: Public Records
Map
Nearby Homes
Your Personal Tour Guide
Ask me questions while you tour the home.