1380 Bellview Rd Rockmart, GA 30153
Estimated Value: $157,804 - $233,000
About This Home
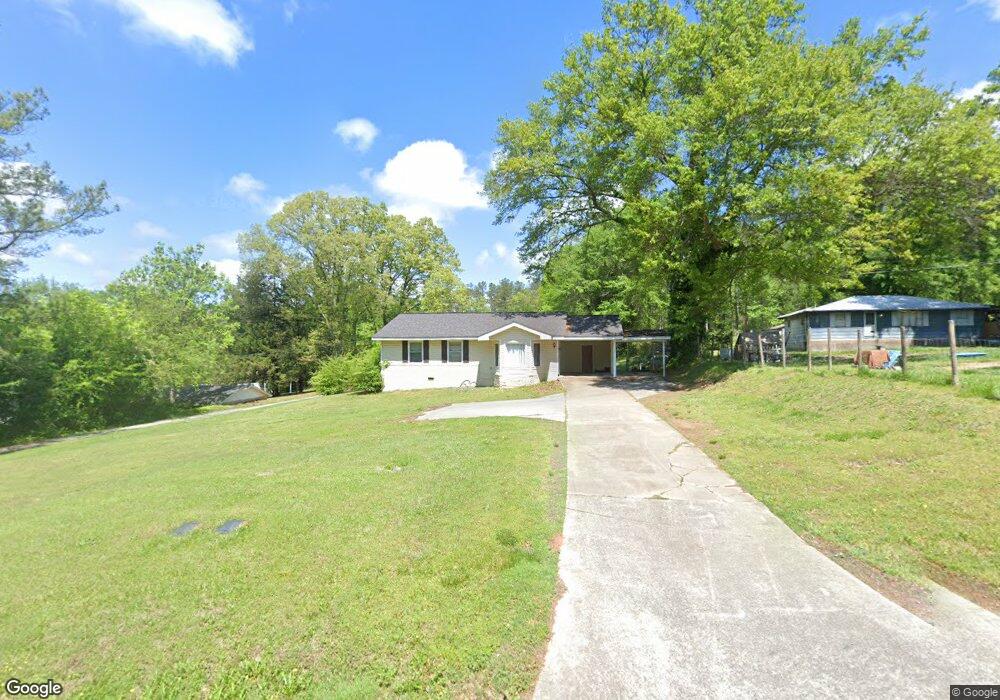
This home is located at 1380 Bellview Rd, Rockmart, GA 30153 and is currently estimated at $205,201, approximately $165 per square foot. 1380 Bellview Rd is a home located in Polk County with nearby schools including Eastside Elementary School, Rockmart Middle School, and Rockmart High School.
Ownership History
We collect this data history from publicly available records. To have your information removed, we recommend requesting removal directly through your county’s website.
Purchase Details
Purchase Details
Purchase Details
Purchase Details
Purchase Details
Purchase Details
Purchase Details
Purchase Details
Purchase Details
Purchase Details
Purchase History
We collect this data history from publicly available records. To have your information removed, we recommend requesting removal directly through your county’s website.
| Date | Buyer | Sale Price | Title Company |
|---|---|---|---|
| -- | -- | ||
| -- | -- | ||
| -- | -- | ||
| -- | -- | ||
| -- | -- | ||
| -- | -- | ||
| -- | -- | ||
| -- | -- | ||
| -- | -- | ||
| -- | -- |
Tax History
We collect this data history from publicly available records. To have your information removed, we recommend requesting removal directly through your county’s website.
| Year | Tax Paid | Tax Assessment Tax Assessment Total Assessment is a certain percentage of the fair market value that is determined by local assessors to be the total taxable value of land and additions on the property. | Land | Improvement |
|---|---|---|---|---|
| 2025 | $874 | $45,668 | $3,084 | $42,584 |
| 2024 | $1,111 | $53,163 | $2,268 | $50,895 |
| 2023 | $820 | $34,552 | $2,268 | $32,284 |
| 2022 | $692 | $29,162 | $1,512 | $27,650 |
| 2021 | $701 | $29,162 | $1,512 | $27,650 |
| 2020 | $702 | $29,162 | $1,512 | $27,650 |
| 2019 | $565 | $21,056 | $1,512 | $19,544 |
| 2018 | $564 | $20,476 | $1,512 | $18,964 |
| 2017 | $193 | $20,584 | $1,620 | $18,964 |
| 2016 | $176 | $19,924 | $960 | $18,964 |
| 2015 | $175 | $19,854 | $960 | $18,894 |
| 2014 | $176 | $19,854 | $960 | $18,894 |
Map
- 2176 N Bellview Rd
- 266 Anderson Rd
- 271 Mccowan Cir
- 1714 Cedartown Hwy
- 49 Bethlehem Rd
- 0 Bethlehem Rd Unit 7730467
- 0 Bethlehem Rd Unit 10705308
- 0 June Kemp Rd Unit 26513501
- 67 Fish Creek Rd
- 214 Horseshoe Cir
- 221 David Price Rd
- 235 N Bellview Rd
- 1038 Stringer Rd
- 0 Price Rd Unit 26862171
- 702 Calloway Dr
- 452 Terry White Rd
- 0 Bellview Rd Unit 7758036
- 0 Bellview Rd Unit 10721444
- 611 Calloway Dr
- 60 Lee St
- 1370 Bellview Rd
- 1400 Bellview Rd
- 1390 Bellview Rd
- 1346 Bellview Rd
- 1450 Bellview Rd
- 1451 Bellview Rd
- 1326 Bellview Rd
- 2330 N Bellview Rd
- 1355 Bellview Rd
- 1458 Bellview Rd Unit 1458
- 1458 Bellview Rd
- 1458 Bellview Rd
- 2240 N Bellview Rd
- 2276 N Bellview Rd
- 1293 Bellview Rd
- 2222 N Bellview Rd
- 1315 Bellview Rd
- 1488 Bellview Rd
- 2260 N Bellview Rd
- 2210 N Bellview Rd
Ask me questions while you tour the home.