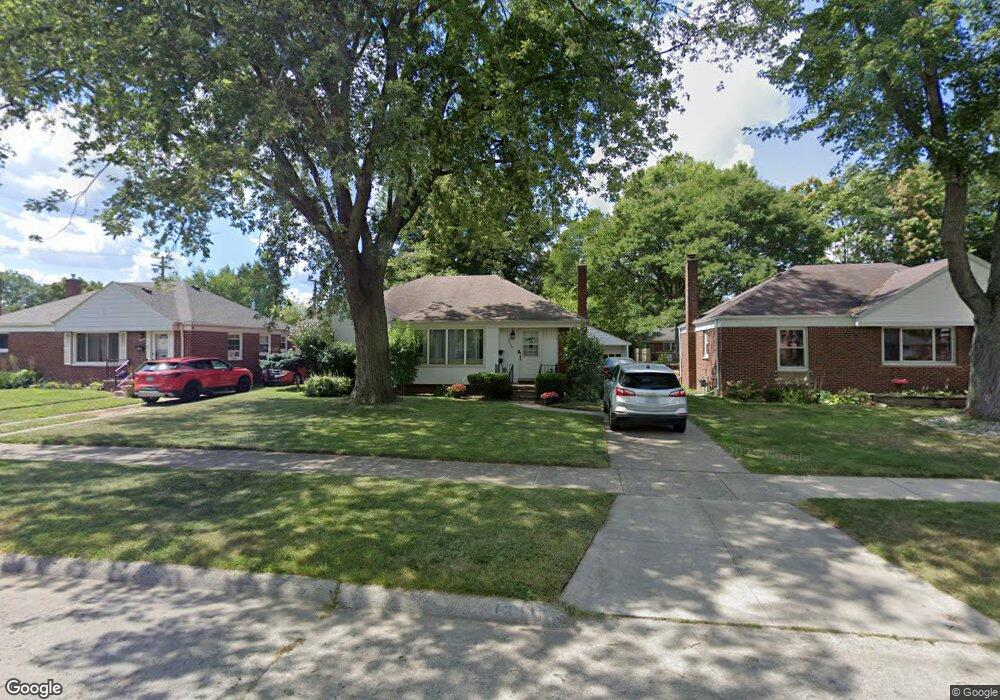
13949 Brady Redford, MI 48239
Estimated Value: $176,953 - $230,000
3
Beds
1
Bath
1,080
Sq Ft
$185/Sq Ft
Est. Value
About This Home
This home is located at 13949 Brady, Redford, MI 48239 and is currently estimated at $199,488, approximately $184 per square foot. 13949 Brady is a home located in Wayne County with nearby schools including John D. Pierce Middle School, Lee M. Thurston High School, and Detroit Leadership Academy.
Ownership History
Date
Name
Owned For
Owner Type
Purchase Details
Closed on
Mar 7, 2022
Sold by
Augusta Smith
Bought by
Parchmon-Kapanda Tiffay
Current Estimated Value
Purchase Details
Closed on
Oct 16, 2009
Sold by
Parchmon Tiffany
Bought by
Smith Augusta
Purchase Details
Closed on
Apr 29, 2009
Sold by
Parchmon Tiffany
Bought by
Wells Fargo Bank Na
Purchase Details
Closed on
Sep 5, 2003
Sold by
Boonstra Richard A and Boonstra Judy E
Bought by
Parchmon Tiffany
Purchase Details
Closed on
Jul 31, 2001
Sold by
Hahn Anneliese
Bought by
Boostra Judy E
Create a Home Valuation Report for This Property
The Home Valuation Report is an in-depth analysis detailing your home's value as well as a comparison with similar homes in the area
Home Values in the Area
Average Home Value in this Area
Purchase History
| Date | Buyer | Sale Price | Title Company |
|---|---|---|---|
| Parchmon-Kapanda Tiffay | -- | None Listed On Document | |
| Smith Augusta | $34,000 | None Available | |
| Wells Fargo Bank Na | $131,536 | None Available | |
| Parchmon Tiffany | $129,900 | Lawyers Title Insurance Co | |
| Boostra Judy E | $95,000 | -- |
Source: Public Records
Tax History
| Year | Tax Paid | Tax Assessment Tax Assessment Total Assessment is a certain percentage of the fair market value that is determined by local assessors to be the total taxable value of land and additions on the property. | Land | Improvement |
|---|---|---|---|---|
| 2025 | $1,162 | $82,000 | $0 | $0 |
| 2024 | $1,129 | $76,500 | $0 | $0 |
| 2023 | $1,080 | $68,700 | $0 | $0 |
| 2022 | $2,546 | $61,100 | $0 | $0 |
| 2021 | $2,185 | $56,600 | $0 | $0 |
| 2020 | $2,155 | $48,900 | $0 | $0 |
| 2019 | $2,109 | $45,600 | $0 | $0 |
| 2018 | $691 | $39,600 | $0 | $0 |
| 2017 | $2,389 | $37,400 | $0 | $0 |
| 2016 | $1,862 | $34,900 | $0 | $0 |
| 2015 | $2,901 | $31,600 | $0 | $0 |
| 2013 | $2,810 | $28,700 | $0 | $0 |
| 2012 | $1,726 | $31,800 | $7,600 | $24,200 |
Source: Public Records
Map
Nearby Homes
- 25246 Schoolcraft
- 24790 Ashley Ct Unit 23
- 13565 Arnold
- 13468 Crosley
- 14120 Dixie
- 13511 Dixie
- 13458 Marion
- 14172 Royal Grand
- 12809 Dixie
- 14437 Lenore
- 25325 Ivanhoe
- 25587 Ivanhoe
- 12908 Riverview St
- 12931 Appleton St
- 15028 Sumner
- 13607 Virgil St
- 24602 Graham Rd
- 15220 Garfield Unit B
- 25301 5 Mile Rd
- 12126 Centralia
Your Personal Tour Guide
Ask me questions while you tour the home.