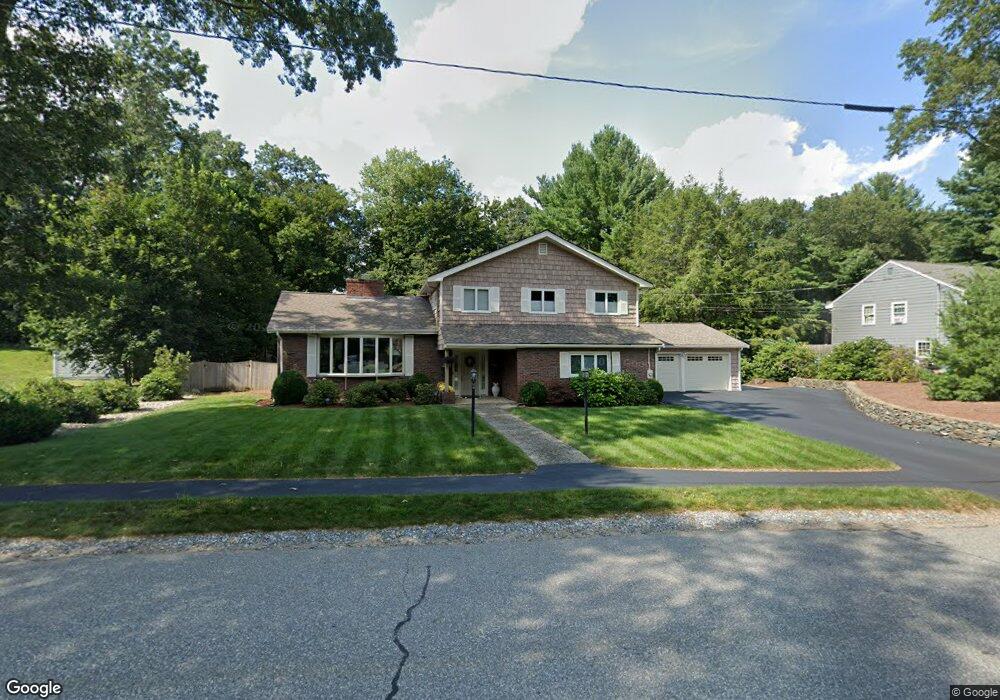
14 Colonial Dr Reading, MA 01867
Estimated Value: $1,134,000 - $1,358,000
3
Beds
3
Baths
3,004
Sq Ft
$429/Sq Ft
Est. Value
About This Home
This home is located at 14 Colonial Dr, Reading, MA 01867 and is currently estimated at $1,288,926, approximately $429 per square foot. 14 Colonial Dr is a home located in Middlesex County with nearby schools including J. Warren Killam Elementary School, Arthur W. Coolidge Middle School, and Reading Memorial High School.
Ownership History
Date
Name
Owned For
Owner Type
Purchase Details
Closed on
Jun 26, 1996
Sold by
Belmonte Joseph J and Belmonte Rose M
Bought by
Ottaviano Stephen P and Ottaviano Lorraine
Current Estimated Value
Create a Home Valuation Report for This Property
The Home Valuation Report is an in-depth analysis detailing your home's value as well as a comparison with similar homes in the area
Home Values in the Area
Average Home Value in this Area
Purchase History
| Date | Buyer | Sale Price | Title Company |
|---|---|---|---|
| Ottaviano Stephen P | $323,000 | -- |
Source: Public Records
Mortgage History
| Date | Status | Borrower | Loan Amount |
|---|---|---|---|
| Open | Ottaviano Stephen P | $250,000 | |
| Closed | Ottaviano Stephen P | $25,000 | |
| Closed | Ottaviano Stephen P | $145,000 |
Source: Public Records
Tax History
| Year | Tax Paid | Tax Assessment Tax Assessment Total Assessment is a certain percentage of the fair market value that is determined by local assessors to be the total taxable value of land and additions on the property. | Land | Improvement |
|---|---|---|---|---|
| 2025 | $12,535 | $1,100,500 | $599,200 | $501,300 |
| 2024 | $12,689 | $1,082,700 | $589,400 | $493,300 |
| 2023 | $11,954 | $949,500 | $516,400 | $433,100 |
| 2022 | $11,946 | $896,200 | $487,100 | $409,100 |
| 2021 | $5,246 | $829,100 | $445,700 | $383,400 |
| 2020 | $4,227 | $788,700 | $423,800 | $364,900 |
| 2019 | $10,553 | $741,600 | $398,200 | $343,400 |
| 2018 | $4,916 | $694,500 | $372,700 | $321,800 |
| 2017 | $9,554 | $681,000 | $365,300 | $315,700 |
| 2016 | $8,665 | $597,600 | $319,000 | $278,600 |
| 2015 | $8,128 | $552,900 | $294,800 | $258,100 |
| 2014 | $7,877 | $534,400 | $284,800 | $249,600 |
Source: Public Records
Map
Nearby Homes
- 61 Beaver Rd
- 43 Ashley Place
- 37 Fairchild Dr
- 43 Wakefield St
- 25 Wakefield St
- 115 Forest St
- 119 Van Norden Rd
- 863 Main St
- 64 Longfellow Rd
- 35 Longfellow Rd
- 41 Winter St
- 103 Orange St
- 31 Zachary Ln
- 89 Grand St
- 52 Sanborn St Unit 7
- 24 Smith Ave
- 150 Grove St
- 237 Salem St Unit 2
- 48 Village St Unit 1001
- 3 Carnation Cir Unit C
Your Personal Tour Guide
Ask me questions while you tour the home.