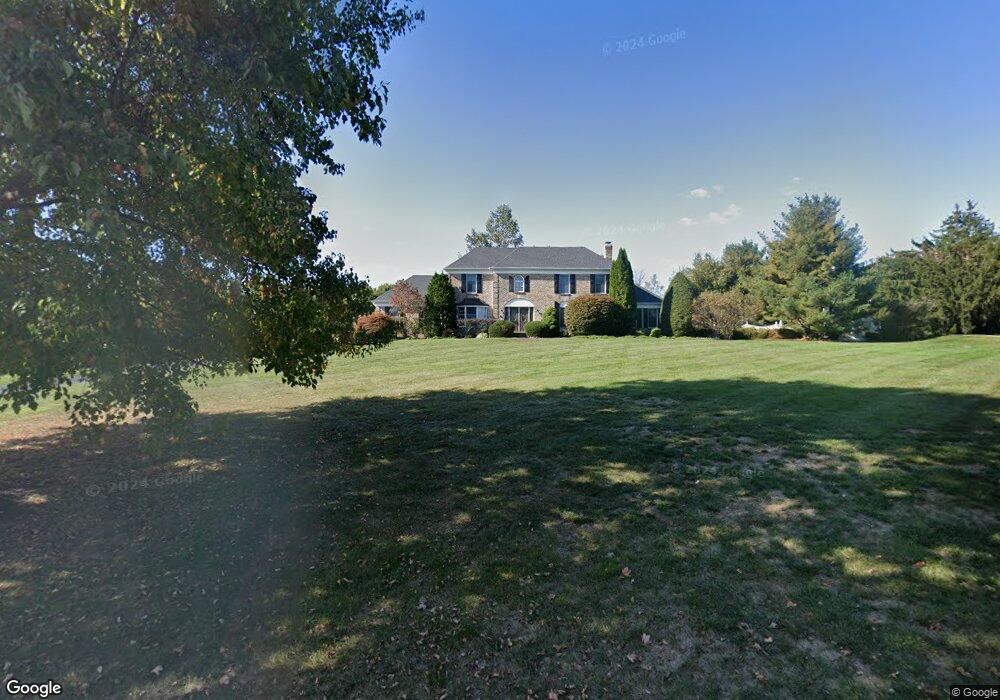
14 Dehoff Dr Flemington, NJ 08822
Estimated Value: $817,196 - $916,000
Studio
--
Bath
3,299
Sq Ft
$265/Sq Ft
Est. Value
About This Home
This home is located at 14 Dehoff Dr, Flemington, NJ 08822 and is currently estimated at $875,549, approximately $265 per square foot. 14 Dehoff Dr is a home located in Hunterdon County with nearby schools including Copper Hill School, J.P. Case Middle School, and Reading Fleming Intermediate School.
Ownership History
Date
Name
Owned For
Owner Type
Purchase Details
Closed on
Aug 12, 2005
Sold by
Duncan Michael David and Duncan Sheila Yvonne
Bought by
Michaels Clifford and Michaels Heather R
Current Estimated Value
Home Financials for this Owner
Home Financials are based on the most recent Mortgage that was taken out on this home.
Original Mortgage
$278,000
Outstanding Balance
$206,076
Interest Rate
5.54%
Mortgage Type
Credit Line Revolving
Estimated Equity
$669,473
Purchase Details
Closed on
Jun 24, 1994
Sold by
Pearson Harry F and Pearson Esther E
Bought by
Duncan Michael David and Duncan Sheila Yvonne
Create a Home Valuation Report for This Property
The Home Valuation Report is an in-depth analysis detailing your home's value as well as a comparison with similar homes in the area
Home Values in the Area
Average Home Value in this Area
Purchase History
| Date | Buyer | Sale Price | Title Company |
|---|---|---|---|
| Michaels Clifford | $672,000 | -- | |
| Duncan Michael David | $345,000 | -- |
Source: Public Records
Mortgage History
| Date | Status | Borrower | Loan Amount |
|---|---|---|---|
| Open | Michaels Clifford | $278,000 | |
| Closed | Michaels Clifford | $359,600 |
Source: Public Records
Tax History
| Year | Tax Paid | Tax Assessment Tax Assessment Total Assessment is a certain percentage of the fair market value that is determined by local assessors to be the total taxable value of land and additions on the property. | Land | Improvement |
|---|---|---|---|---|
| 2025 | $17,298 | $597,100 | $225,500 | $371,600 |
| 2024 | $16,265 | $597,100 | $225,500 | $371,600 |
| 2023 | $16,265 | $597,100 | $225,500 | $371,600 |
| 2022 | $15,853 | $597,100 | $225,500 | $371,600 |
| 2021 | $15,041 | $597,100 | $225,500 | $371,600 |
| 2020 | $15,351 | $597,100 | $225,500 | $371,600 |
| 2019 | $15,041 | $597,100 | $225,500 | $371,600 |
| 2018 | $14,856 | $597,100 | $225,500 | $371,600 |
| 2017 | $14,629 | $597,100 | $225,500 | $371,600 |
| 2016 | $14,366 | $597,100 | $225,500 | $371,600 |
| 2015 | $14,002 | $597,100 | $225,500 | $371,600 |
| 2014 | $13,817 | $597,100 | $225,500 | $371,600 |
Source: Public Records
Map
Nearby Homes
- 250 Old York Rd
- 30 Claridge Ln
- 423 Wertsville Rd
- 15 Welisewitz Rd
- 38 Larsen Rd
- 822 Poplar Ct Unit 822
- 628 Almond Ct
- 269 Spruce Ct Unit 269
- 262 Spruce Ct
- 4 Peach Ct
- 233 Spruce Ct Unit 233
- 111 Wertsville Rd
- 418 Hawthorne Ct
- 1 Joseph Dr
- 18 Danberry Dr
- 3 Indian Plantation St Unit 3
- 106 Franklin Ct Unit 238
- 107 Franklin Ct Unit 239
- 7 Lake Ct
- 16 Lake Ct
Your Personal Tour Guide
Ask me questions while you tour the home.