Estimated Value: $1,296,000 - $1,730,357
4
Beds
3
Baths
2,832
Sq Ft
$556/Sq Ft
Est. Value
About This Home
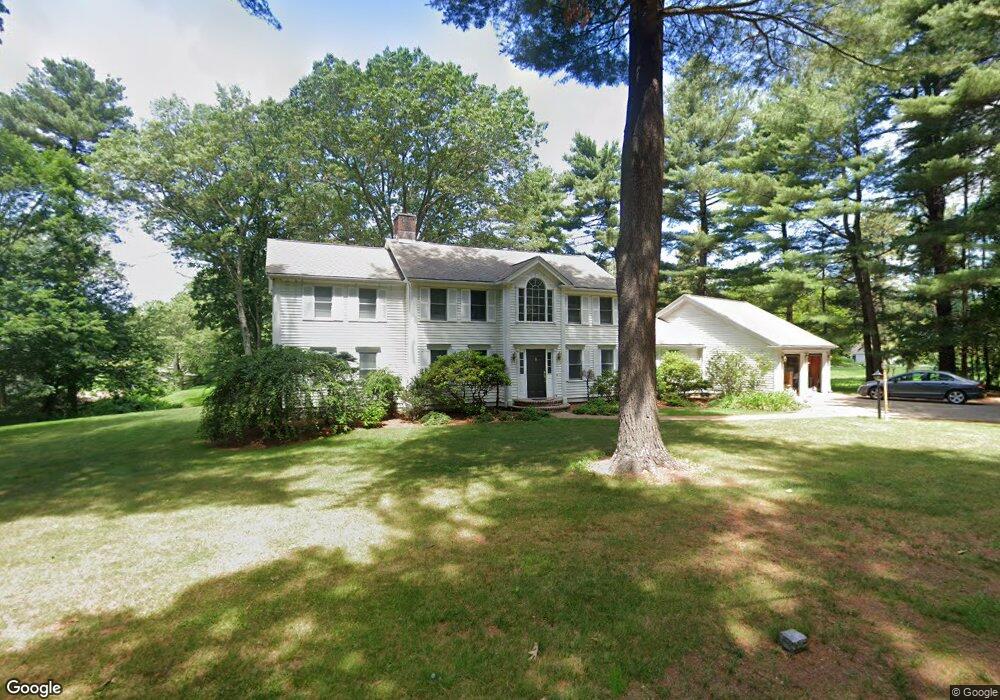
This home is located at 14 Powisset St, Dover, MA 02030 and is currently estimated at $1,573,339, approximately $555 per square foot. 14 Powisset St is a home located in Norfolk County with nearby schools including Chickering Elementary School, Dover-Sherborn Regional Middle School, and Dover-Sherborn Regional High School.
Ownership History
Date
Name
Owned For
Owner Type
Purchase Details
Closed on
Jul 24, 1987
Sold by
Dimock Donna R
Bought by
Dakessian Garo K
Current Estimated Value
Create a Home Valuation Report for This Property
The Home Valuation Report is an in-depth analysis detailing your home's value as well as a comparison with similar homes in the area
Home Values in the Area
Average Home Value in this Area
Purchase History
We collect this data history from publicly available records. To have your information removed, we recommend requesting removal directly through your county’s website.
| Date | Buyer | Sale Price | Title Company |
|---|---|---|---|
| Dakessian Garo K | $290,000 | -- |
Source: Public Records
Mortgage History
We collect this data history from publicly available records. To have your information removed, we recommend requesting removal directly through your county’s website.
| Date | Status | Borrower | Loan Amount |
|---|---|---|---|
| Open | Dakessian Garo K | $26,000 | |
| Open | Dakessian Garo K | $100,000 | |
| Closed | Dakessian Garo K | $150,000 | |
| Closed | Dakessian Garo K | $36,500 |
Source: Public Records
Tax History
| Year | Tax Paid | Tax Assessment Tax Assessment Total Assessment is a certain percentage of the fair market value that is determined by local assessors to be the total taxable value of land and additions on the property. | Land | Improvement |
|---|---|---|---|---|
| 2025 | $18,546 | $1,645,600 | $1,130,300 | $515,300 |
| 2024 | $17,683 | $1,613,400 | $1,130,300 | $483,100 |
| 2023 | $17,863 | $1,465,400 | $1,033,700 | $431,700 |
| 2022 | $17,582 | $1,415,600 | $1,033,700 | $381,900 |
| 2021 | $16,672 | $1,293,400 | $924,800 | $368,600 |
| 2020 | $16,607 | $1,293,400 | $924,800 | $368,600 |
| 2019 | $16,724 | $1,293,400 | $924,800 | $368,600 |
| 2018 | $13,108 | $1,020,900 | $666,200 | $354,700 |
| 2017 | $12,623 | $967,300 | $611,800 | $355,500 |
| 2016 | $12,459 | $967,300 | $611,800 | $355,500 |
| 2015 | $11,904 | $937,300 | $581,800 | $355,500 |
Source: Public Records
Map
Nearby Homes
Your Personal Tour Guide
Ask me questions while you tour the home.