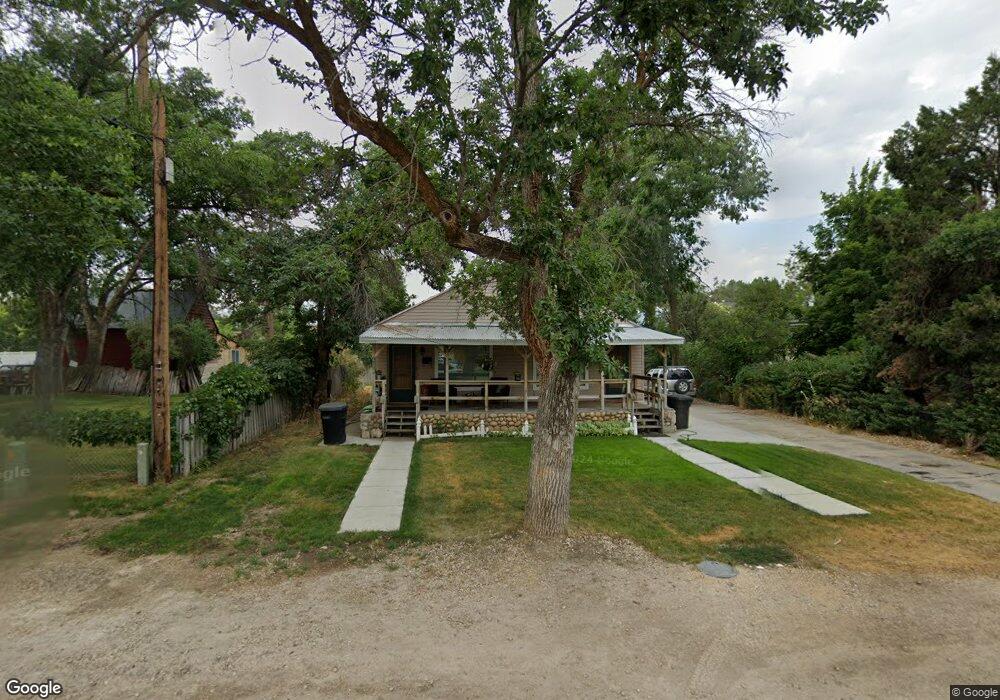
142 E 400 S Heber City, UT 84032
Estimated Value: $534,520 - $595,000
Studio
--
Bath
1,338
Sq Ft
$429/Sq Ft
Est. Value
About This Home
This home is located at 142 E 400 S, Heber City, UT 84032 and is currently estimated at $574,380, approximately $429 per square foot. 142 E 400 S is a home with nearby schools including Old Mill School and Wasatch High School.
Ownership History
Date
Name
Owned For
Owner Type
Purchase Details
Closed on
Feb 19, 2022
Sold by
Jensen Family Trust and Jensen John M
Bought by
1995 Jensen Family Trust and Jensen
Current Estimated Value
Purchase Details
Closed on
Aug 25, 2016
Sold by
Barker Sue
Bought by
Wsb Properties Llc
Home Financials for this Owner
Home Financials are based on the most recent Mortgage that was taken out on this home.
Original Mortgage
$200,000
Interest Rate
3.43%
Mortgage Type
Credit Line Revolving
Purchase Details
Closed on
Nov 15, 2005
Sold by
Tuttle Brian D and Tuttle Gina A
Bought by
Barker Sue
Home Financials for this Owner
Home Financials are based on the most recent Mortgage that was taken out on this home.
Original Mortgage
$126,750
Interest Rate
5.93%
Mortgage Type
New Conventional
Create a Home Valuation Report for This Property
The Home Valuation Report is an in-depth analysis detailing your home's value as well as a comparison with similar homes in the area
Home Values in the Area
Average Home Value in this Area
Purchase History
We collect this data history from publicly available records. To have your information removed, we recommend requesting removal directly through your county’s website.
| Date | Buyer | Sale Price | Title Company |
|---|---|---|---|
| 1995 Jensen Family Trust | -- | None Listed On Document | |
| Wsb Properties Llc | -- | Us Title Park City | |
| Barker Sue | -- | First American Title Heber |
Source: Public Records
Mortgage History
We collect this data history from publicly available records. To have your information removed, we recommend requesting removal directly through your county’s website.
| Date | Status | Borrower | Loan Amount |
|---|---|---|---|
| Previous Owner | Wsb Properties Llc | $200,000 | |
| Previous Owner | Barker Sue | $126,750 |
Source: Public Records
Tax History
| Year | Tax Paid | Tax Assessment Tax Assessment Total Assessment is a certain percentage of the fair market value that is determined by local assessors to be the total taxable value of land and additions on the property. | Land | Improvement |
|---|---|---|---|---|
| 2025 | $2,672 | $521,471 | $240,000 | $281,471 |
| 2024 | $2,311 | $454,080 | $240,000 | $214,080 |
| 2023 | $2,311 | $381,320 | $125,000 | $256,320 |
| 2022 | $2,146 | $385,620 | $125,000 | $260,620 |
| 2021 | $2,857 | $407,857 | $114,000 | $293,857 |
| 2020 | $2,839 | $349,031 | $100,000 | $249,031 |
| 2019 | $2,017 | $162,817 | $0 | $0 |
| 2018 | $1,583 | $127,765 | $0 | $0 |
| 2017 | $1,407 | $112,954 | $0 | $0 |
| 2016 | $1,288 | $100,700 | $0 | $0 |
| 2015 | $1,038 | $85,098 | $0 | $0 |
| 2014 | $1,048 | $85,098 | $0 | $0 |
Source: Public Records
Map
Nearby Homes
Your Personal Tour Guide
Ask me questions while you tour the home.