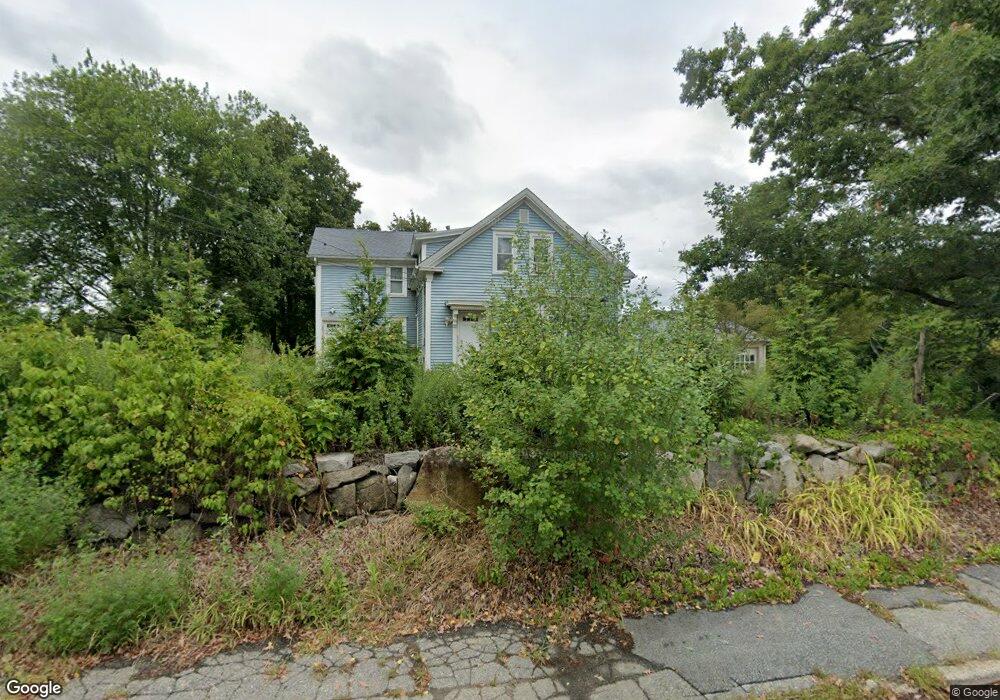
1429 Centerville Rd Warwick, RI 02886
Bald Hill NeighborhoodEstimated Value: $492,417 - $559,000
5
Beds
2
Baths
1,773
Sq Ft
$296/Sq Ft
Est. Value
About This Home
This home is located at 1429 Centerville Rd, Warwick, RI 02886 and is currently estimated at $525,604, approximately $296 per square foot. 1429 Centerville Rd is a home located in Kent County.
Ownership History
Date
Name
Owned For
Owner Type
Purchase Details
Closed on
Mar 10, 2010
Sold by
Hsbc Bank Usa
Bought by
Pires Luis C
Current Estimated Value
Home Financials for this Owner
Home Financials are based on the most recent Mortgage that was taken out on this home.
Original Mortgage
$132,000
Outstanding Balance
$86,973
Interest Rate
5.02%
Mortgage Type
Purchase Money Mortgage
Estimated Equity
$438,631
Purchase Details
Closed on
Oct 26, 2009
Sold by
Pianka Peter P and Hsbc Bank Usa
Bought by
Hsbc Bank Usa
Create a Home Valuation Report for This Property
The Home Valuation Report is an in-depth analysis detailing your home's value as well as a comparison with similar homes in the area
Home Values in the Area
Average Home Value in this Area
Purchase History
We collect this data history from publicly available records. To have your information removed, we recommend requesting removal directly through your county’s website.
| Date | Buyer | Sale Price | Title Company |
|---|---|---|---|
| Pires Luis C | $165,001 | -- | |
| Hsbc Bank Usa | $152,500 | -- | |
| Hsbc Bank Usa | $152,500 | -- |
Source: Public Records
Mortgage History
We collect this data history from publicly available records. To have your information removed, we recommend requesting removal directly through your county’s website.
| Date | Status | Borrower | Loan Amount |
|---|---|---|---|
| Open | Hsbc Bank Usa | $132,000 | |
| Previous Owner | Hsbc Bank Usa | $230,000 | |
| Previous Owner | Hsbc Bank Usa | $226,000 |
Source: Public Records
Tax History
| Year | Tax Paid | Tax Assessment Tax Assessment Total Assessment is a certain percentage of the fair market value that is determined by local assessors to be the total taxable value of land and additions on the property. | Land | Improvement |
|---|---|---|---|---|
| 2025 | $5,676 | $446,900 | $145,200 | $301,700 |
| 2024 | $4,604 | $318,200 | $116,100 | $202,100 |
| 2023 | $4,515 | $318,200 | $116,100 | $202,100 |
| 2022 | $4,300 | $229,600 | $69,400 | $160,200 |
| 2021 | $4,300 | $229,600 | $69,400 | $160,200 |
| 2020 | $4,300 | $229,600 | $69,400 | $160,200 |
| 2019 | $4,300 | $229,600 | $69,400 | $160,200 |
| 2018 | $4,133 | $198,700 | $66,800 | $131,900 |
| 2017 | $4,022 | $198,700 | $66,800 | $131,900 |
| 2016 | $4,022 | $198,700 | $66,800 | $131,900 |
| 2015 | $4,588 | $221,100 | $80,100 | $141,000 |
| 2014 | $4,435 | $221,100 | $80,100 | $141,000 |
| 2013 | $4,376 | $221,100 | $80,100 | $141,000 |
Source: Public Records
Map
Nearby Homes
Your Personal Tour Guide
Ask me questions while you tour the home.