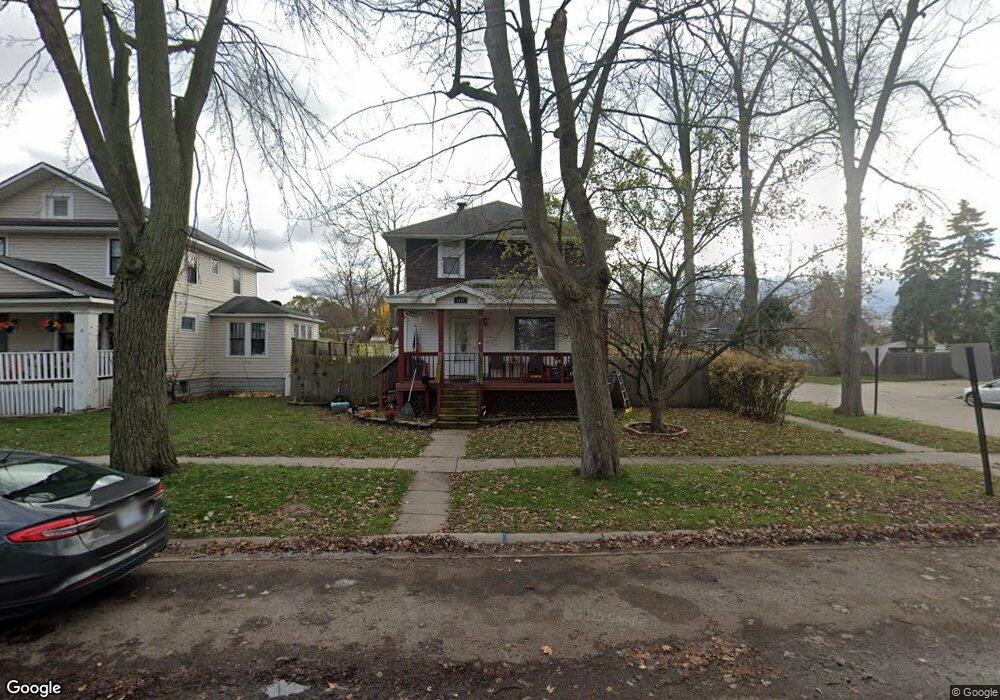
1434 Howard St Port Huron, MI 48060
Estimated Value: $125,000 - $158,000
4
Beds
2
Baths
1,408
Sq Ft
$100/Sq Ft
Est. Value
About This Home
This home is located at 1434 Howard St, Port Huron, MI 48060 and is currently estimated at $140,963, approximately $100 per square foot. 1434 Howard St is a home located in St. Clair County with nearby schools including Michigamme Elementary School, Central Middle School, and Port Huron High School.
Ownership History
Date
Name
Owned For
Owner Type
Purchase Details
Closed on
Jan 12, 2011
Sold by
Cranney Bradley S
Bought by
Du Yufang
Current Estimated Value
Purchase Details
Closed on
Feb 22, 2010
Sold by
Boddington Pamela
Bought by
Cranney Bradley S and Du Yufang
Purchase Details
Closed on
Jan 21, 2010
Sold by
Melody Richard Paul and Melody Richard
Bought by
Boddington Pamela
Purchase Details
Closed on
Jul 30, 2009
Sold by
Richard Paul M and Richard Melody J
Bought by
Chase Home Finance Llc
Create a Home Valuation Report for This Property
The Home Valuation Report is an in-depth analysis detailing your home's value as well as a comparison with similar homes in the area
Home Values in the Area
Average Home Value in this Area
Purchase History
| Date | Buyer | Sale Price | Title Company |
|---|---|---|---|
| Du Yufang | -- | Fidelity National Title Ins | |
| Cranney Bradley S | $25,000 | None Available | |
| Boddington Pamela | $20,600 | None Available | |
| Chase Home Finance Llc | $118,693 | None Available |
Source: Public Records
Tax History
| Year | Tax Paid | Tax Assessment Tax Assessment Total Assessment is a certain percentage of the fair market value that is determined by local assessors to be the total taxable value of land and additions on the property. | Land | Improvement |
|---|---|---|---|---|
| 2025 | $1,756 | $64,000 | $0 | $0 |
| 2024 | $1,709 | $61,000 | $0 | $0 |
| 2023 | $1,618 | $55,700 | $0 | $0 |
| 2022 | $1,603 | $48,900 | $0 | $0 |
| 2020 | $1,597 | $40,800 | $40,800 | $0 |
| 2019 | $1,509 | $29,800 | $0 | $0 |
| 2018 | $1,476 | $29,800 | $0 | $0 |
| 2017 | $1,355 | $25,700 | $0 | $0 |
| 2016 | $1,202 | $25,700 | $0 | $0 |
| 2015 | $1,179 | $23,300 | $23,300 | $0 |
| 2014 | $1,179 | $21,900 | $21,900 | $0 |
| 2013 | -- | $22,000 | $0 | $0 |
Source: Public Records
Map
Nearby Homes
Your Personal Tour Guide
Ask me questions while you tour the home.