144 Sea View Dr Warwick, RI 02889
Oakland Beach NeighborhoodEstimated Value: $296,424 - $322,000
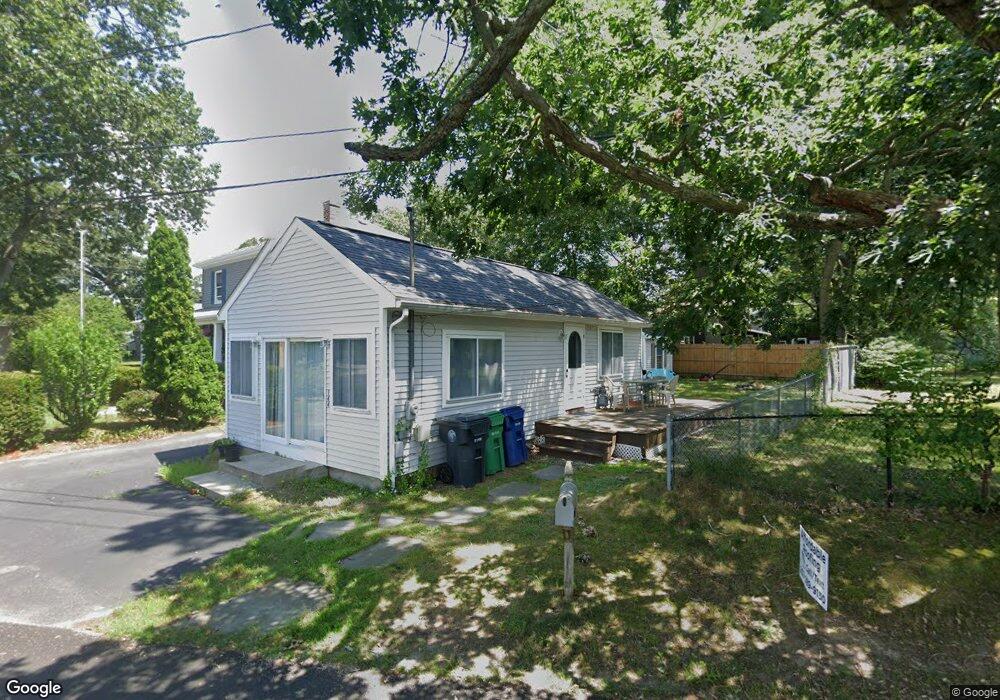
About This Home
This home is located at 144 Sea View Dr, Warwick, RI 02889 and is currently estimated at $307,356, approximately $640 per square foot. 144 Sea View Dr is a home located in Kent County with nearby schools including Saint Kevin School, St Rose Of Lima School, and Bishop Hendricken High School.
Ownership History
We collect this data history from publicly available records. To have your information removed, we recommend requesting removal directly through your county’s website.
Purchase Details
Home Values in the Area
Average Home Value in this Area
Purchase History
We collect this data history from publicly available records. To have your information removed, we recommend requesting removal directly through your county’s website.
| Date | Buyer | Sale Price | Title Company |
|---|---|---|---|
| $37,000 | -- |
Tax History
We collect this data history from publicly available records. To have your information removed, we recommend requesting removal directly through your county’s website.
| Year | Tax Paid | Tax Assessment Tax Assessment Total Assessment is a certain percentage of the fair market value that is determined by local assessors to be the total taxable value of land and additions on the property. | Land | Improvement |
|---|---|---|---|---|
| 2025 | $3,757 | $295,800 | $145,000 | $150,800 |
| 2024 | $2,910 | $201,100 | $119,100 | $82,000 |
| 2023 | $2,854 | $201,100 | $119,100 | $82,000 |
| 2022 | $2,214 | $118,200 | $72,300 | $45,900 |
| 2021 | $2,214 | $118,200 | $72,300 | $45,900 |
| 2020 | $2,214 | $118,200 | $72,300 | $45,900 |
| 2019 | $2,214 | $118,200 | $72,300 | $45,900 |
| 2018 | $2,070 | $99,500 | $65,800 | $33,700 |
| 2017 | $2,014 | $99,500 | $65,800 | $33,700 |
| 2016 | $2,014 | $99,500 | $65,800 | $33,700 |
| 2015 | $2,067 | $99,600 | $67,200 | $32,400 |
| 2014 | $1,998 | $99,600 | $67,200 | $32,400 |
| 2013 | $1,971 | $99,600 | $67,200 | $32,400 |
Map
Ask me questions while you tour the home.