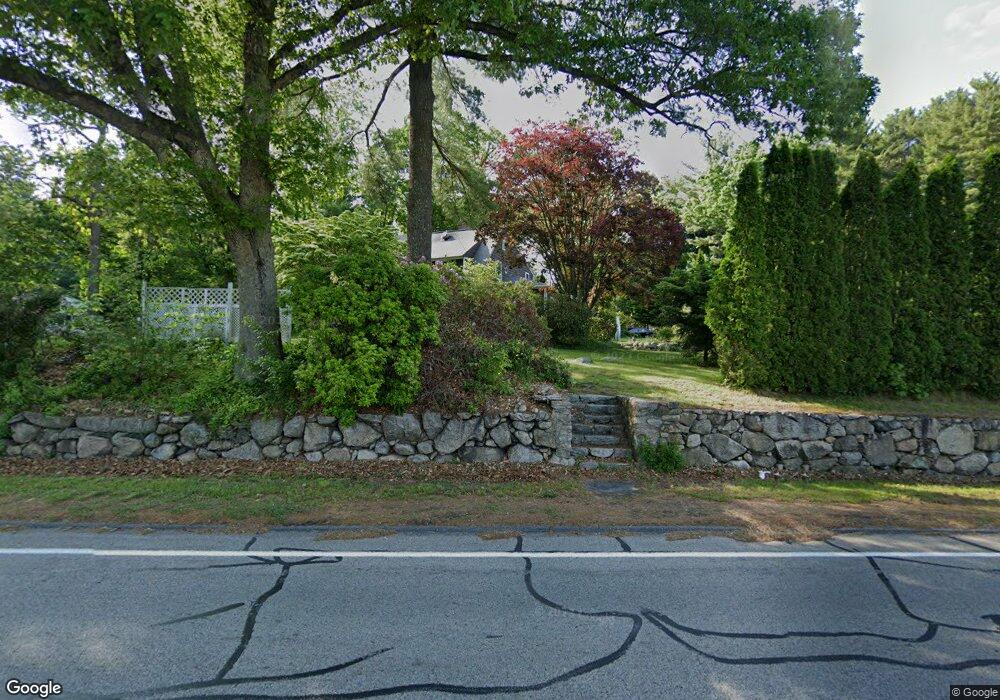
145 E Main St Hopkinton, MA 01748
Estimated Value: $725,067 - $802,000
5
Beds
4
Baths
2,225
Sq Ft
$335/Sq Ft
Est. Value
About This Home
This home is located at 145 E Main St, Hopkinton, MA 01748 and is currently estimated at $745,017, approximately $334 per square foot. 145 E Main St is a home located in Middlesex County with nearby schools including Elmwood Elementary School, Hopkins Elementary School, and Marathon Elementary School.
Ownership History
Date
Name
Owned For
Owner Type
Purchase Details
Closed on
May 11, 2015
Sold by
Flannery Eugene E and Flannery Ollie M
Bought by
Tofani-Martin Jane E and Flannery Eugene E
Current Estimated Value
Purchase Details
Closed on
Feb 6, 1963
Bought by
Flannery Eugene E and Tofani-Martin Jane E
Create a Home Valuation Report for This Property
The Home Valuation Report is an in-depth analysis detailing your home's value as well as a comparison with similar homes in the area
Home Values in the Area
Average Home Value in this Area
Purchase History
| Date | Buyer | Sale Price | Title Company |
|---|---|---|---|
| Tofani-Martin Jane E | -- | -- | |
| Flannery Eugene E | -- | -- |
Source: Public Records
Mortgage History
| Date | Status | Borrower | Loan Amount |
|---|---|---|---|
| Previous Owner | Flannery Eugene E | $100,000 | |
| Previous Owner | Flannery Eugene E | $70,000 | |
| Previous Owner | Flannery Eugene E | $70,000 | |
| Previous Owner | Flannery Eugene E | $20,000 |
Source: Public Records
Tax History
| Year | Tax Paid | Tax Assessment Tax Assessment Total Assessment is a certain percentage of the fair market value that is determined by local assessors to be the total taxable value of land and additions on the property. | Land | Improvement |
|---|---|---|---|---|
| 2025 | $8,124 | $572,900 | $238,600 | $334,300 |
| 2024 | $7,990 | $546,900 | $227,300 | $319,600 |
| 2023 | $7,794 | $493,000 | $199,400 | $293,600 |
| 2022 | $7,646 | $449,000 | $181,300 | $267,700 |
| 2021 | $7,406 | $433,600 | $175,800 | $257,800 |
| 2020 | $7,048 | $419,000 | $171,600 | $247,400 |
| 2019 | $6,514 | $379,400 | $165,300 | $214,100 |
| 2018 | $5,741 | $339,700 | $157,300 | $182,400 |
| 2017 | $5,510 | $328,000 | $152,700 | $175,300 |
| 2016 | $5,448 | $319,900 | $149,700 | $170,200 |
| 2015 | -- | $300,700 | $145,500 | $155,200 |
Source: Public Records
Map
Nearby Homes
- 30 Wayside Dr Unit 30
- 19 Crispwater Way Unit 178
- 8 Crispwater Way Unit 8
- 5 Heartwood Way Unit 123
- 15 Pennock Rd
- 4 Grandview Dr
- 2 Grandview Dr
- 9 Olive St
- 30 Pennock Rd
- 8 Haven Way
- 0 Cross St
- 22 Wilbur Dr
- 71 Pennock Rd
- 7 Deer Ridge Rd
- 24 Russet Hill Rd
- 128 Clinton St
- 6 Waterville Ln Unit 6
- 14 Waterville Ln Unit 14
- 30 Alprilla Farm Rd
- 28 Waterville Ln Unit 28
Your Personal Tour Guide
Ask me questions while you tour the home.