J
Seller's Agent in 2019
James Carter
Lindsey & Assoc Inc Branch

Estimated Value: $378,000 - $447,000
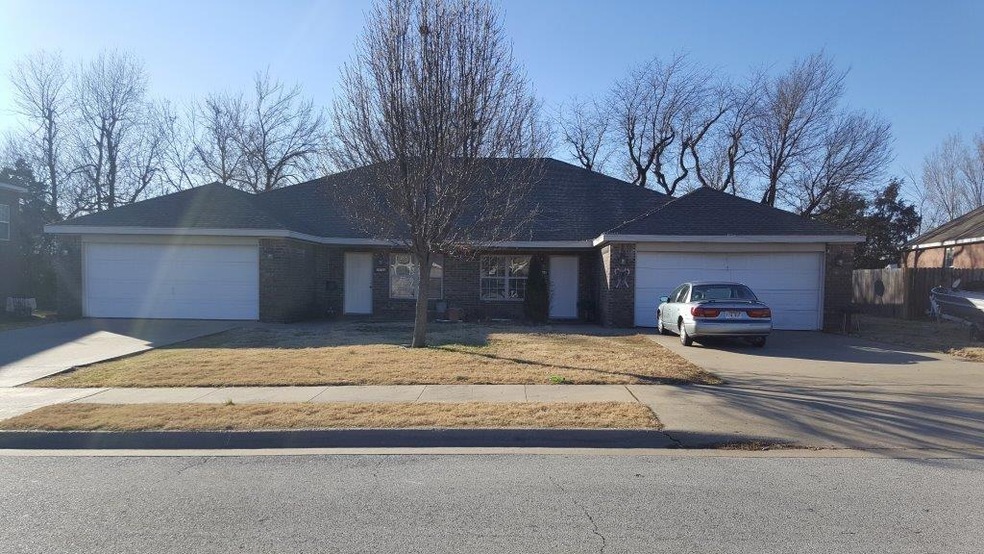
Make 9% on your investment in this currently leased duplex in Northeast Springdale. Each side is 3 BR, 2 BTH, approx 1,450 sq ft. Both sides repainted in 11/18 and new carpet in Unit B(North unit). Long term tenants in both units, will likely stay in place.
Last Agent to Sell the Property
James Carter
Lindsey & Assoc Inc Branch License #EB00075060 Listed on: 01/07/2019
We collect this data history from publicly available records. To have your information removed, we recommend requesting removal directly through your county’s website.
We collect this data history from publicly available records. To have your information removed, we recommend requesting removal directly through your county’s website.
| Date | Buyer | Sale Price | Title Company |
|---|---|---|---|
| $11,333 | None Listed On Document | ||
| $225,000 | Pci Advance Title | ||
| -- | None Available | ||
| -- | None Available | ||
| $99,000 | Associates Closing & Title | ||
| $127,423 | None Available | ||
| $248,000 | None Available | ||
| $226,000 | -- |
We collect this data history from publicly available records. To have your information removed, we recommend requesting removal directly through your county’s website.
| Date | Status | Borrower | Loan Amount |
|---|---|---|---|
| Previous Owner | $180,000 | ||
| Previous Owner | $104,775 | ||
| Previous Owner | $248,000 | ||
| Previous Owner | $180,800 | ||
| Closed | $45,200 |
We collect this data history from publicly available records. To have your information removed, we recommend requesting removal directly through your county’s website.
| Date | Event | Price | List to Sale | Price per Sq Ft |
|---|---|---|---|---|
| 02/22/2019 02/22/19 | Sold | $225,000 | +3.3% | $77 / Sq Ft |
| 01/23/2019 01/23/19 | Pending | -- | -- | -- |
| 01/07/2019 01/07/19 | For Sale | $217,900 | -- | $75 / Sq Ft |
We collect this data history from publicly available records. To have your information removed, we recommend requesting removal directly through your county’s website.
| Year | Tax Paid | Tax Assessment Tax Assessment Total Assessment is a certain percentage of the fair market value that is determined by local assessors to be the total taxable value of land and additions on the property. | Land | Improvement |
|---|---|---|---|---|
| 2025 | $3,108 | $70,770 | $14,000 | $56,770 |
| 2024 | $2,869 | $70,770 | $14,000 | $56,770 |
| 2023 | $2,681 | $70,770 | $14,000 | $56,770 |
| 2022 | $2,437 | $46,250 | $6,000 | $40,250 |
| 2021 | $2,437 | $46,250 | $6,000 | $40,250 |
| 2020 | $2,437 | $46,250 | $6,000 | $40,250 |
| 2019 | $1,317 | $24,990 | $5,000 | $19,990 |
| 2018 | $1,317 | $24,990 | $5,000 | $19,990 |
| 2017 | $1,304 | $24,990 | $5,000 | $19,990 |
| 2016 | $1,304 | $24,990 | $5,000 | $19,990 |
| 2015 | $1,304 | $24,990 | $5,000 | $19,990 |
| 2014 | $1,284 | $24,590 | $5,500 | $19,090 |
J
Seller's Agent in 2019
James Carter
Lindsey & Assoc Inc Branch
R
Buyer's Agent in 2019
Raul Pena
Equity Partners Realty
(479) 445-9898
36 Total Sales
Source: ArkansasOne MLS
MLS Number: 1100403
APN: 815-36706-000
Disclaimer: Certain information contained herein is derived from information provided by parties other than Homes.com. All information provided is deemed reliable, but is not guaranteed to be accurate and should be independently verified.
![]() IDX information is provided exclusively for personal, non-commercial use, and may not be used for any purpose other than to identify prospective properties consumers may be interested in purchasing. Information is deemed reliable but not guaranteed.
IDX information is provided exclusively for personal, non-commercial use, and may not be used for any purpose other than to identify prospective properties consumers may be interested in purchasing. Information is deemed reliable but not guaranteed.
Ask me questions while you tour the home.
