146 Marble Rd Barnstable, MA 02630
Barnstable Village NeighborhoodEstimated Value: $722,473 - $880,000
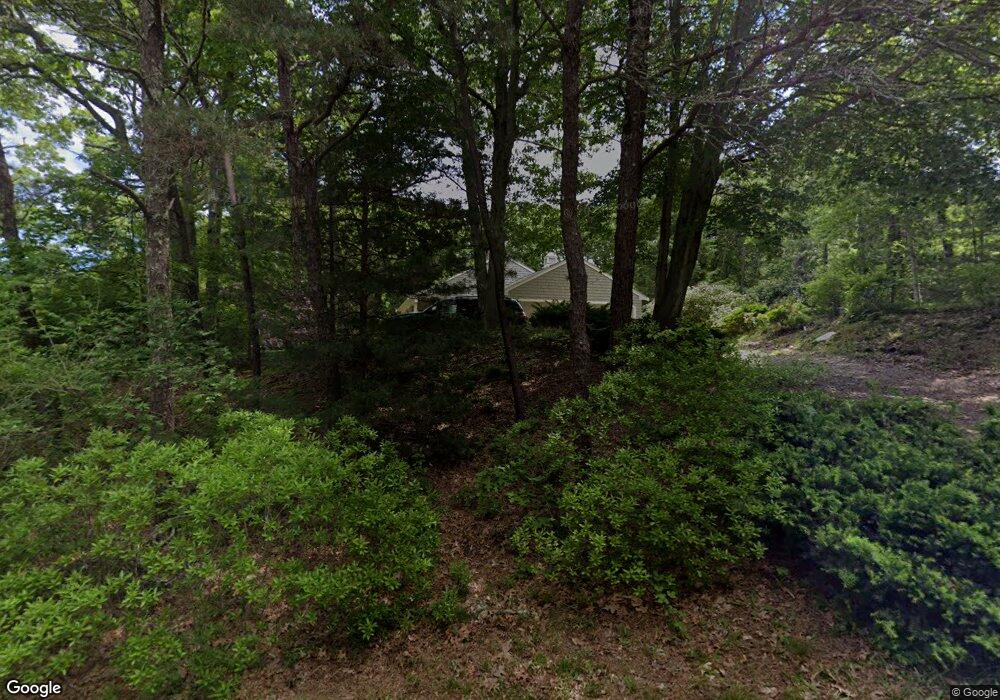
About This Home
This home is located at 146 Marble Rd, Barnstable, MA 02630 and is currently estimated at $780,868, approximately $528 per square foot. 146 Marble Rd is a home located in Barnstable County with nearby schools including West Barnstable Elementary School, Barnstable United Elementary School, and Barnstable Intermediate School.
Ownership History
We collect this data history from publicly available records. To have your information removed, we recommend requesting removal directly through your county’s website.
Purchase Details
Home Financials for this Owner
Home Financials are based on the most recent Mortgage that was taken out on this home.Purchase Details
Home Values in the Area
Average Home Value in this Area
Purchase History
We collect this data history from publicly available records. To have your information removed, we recommend requesting removal directly through your county’s website.
| Date | Buyer | Sale Price | Title Company |
|---|---|---|---|
| $325,000 | -- | ||
| -- | -- | ||
| -- | -- |
Mortgage History
We collect this data history from publicly available records. To have your information removed, we recommend requesting removal directly through your county’s website.
| Date | Status | Borrower | Loan Amount |
|---|---|---|---|
| Open | $308,705 | ||
| Previous Owner | $30,000 | ||
| Previous Owner | $27,000 |
Tax History
We collect this data history from publicly available records. To have your information removed, we recommend requesting removal directly through your county’s website.
| Year | Tax Paid | Tax Assessment Tax Assessment Total Assessment is a certain percentage of the fair market value that is determined by local assessors to be the total taxable value of land and additions on the property. | Land | Improvement |
|---|---|---|---|---|
| 2025 | $6,167 | $667,400 | $243,000 | $424,400 |
| 2024 | $5,829 | $665,400 | $243,000 | $422,400 |
| 2023 | $5,338 | $594,400 | $220,900 | $373,500 |
| 2022 | $5,357 | $480,000 | $151,900 | $328,100 |
| 2021 | $5,020 | $428,700 | $154,300 | $274,400 |
| 2020 | $5,198 | $424,000 | $154,300 | $269,700 |
| 2019 | $4,988 | $408,200 | $163,600 | $244,600 |
| 2018 | $5,047 | $401,200 | $190,700 | $210,500 |
| 2017 | $4,848 | $387,800 | $190,700 | $197,100 |
| 2016 | $4,737 | $384,200 | $187,200 | $197,000 |
| 2015 | $4,094 | $338,100 | $152,400 | $185,700 |
Map
- 122 Salt Rock Rd
- 121 Salt Rock Rd
- 284 Braggs Ln
- 417 Commerce Rd
- 79 Bayberry Ln
- 30 Indian Trail
- 50 & 0 Indian Trail
- 170 Althea Dr
- 44 Iris Ln
- 55 Tonela Ln
- 218 Oakmont Rd
- 0 Indian Trail
- 153 Oakmont Dr
- 153 Oakmont Dr
- 93 Oakmont Dr Unit Lot 2
- 61 Old Phinneys Ln
- 64 Wingfoot Dr
- 45 Old Phinney's Ln
- 65 Oakmont Rd
- 79 Sturgis Ln
- 138 Marble Rd
- 30 Granite Ln
- 11 Granite Ln
- 44 Granite Ln
- 59 Granite Ln
- 20 Granite Ln
- 139 Marble Rd
- 56 Granite Ln
- 56 Granite Ln
- 117 Cobblestone Rd
- 8 Granite Ln
- 117 Cobble Stone Obbles
- 113 Marble Rd
- 68 Granite Ln
- 105 Cobblestone Rd
- 175 Cobble Stone Rd
- 175 Cobblestone Rd
- 103 Cobblestone Rd
- 142 Salt Rock Rd
- 91 Cobblestone Rd
Ask me questions while you tour the home.