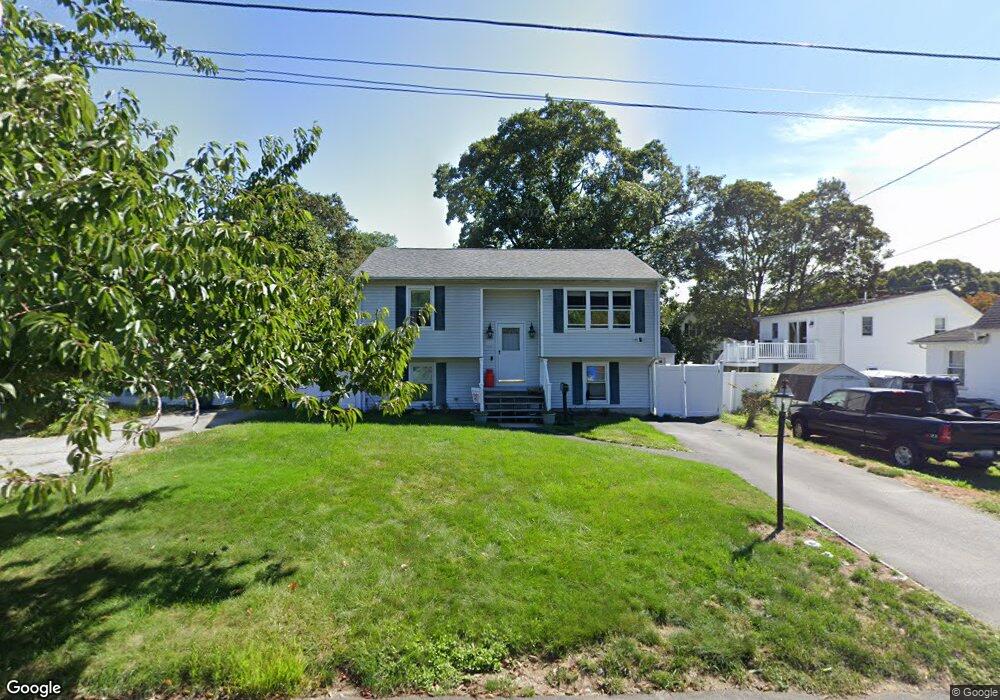
146 Providence Ave Riverside, RI 02915
Riverside NeighborhoodEstimated Value: $426,000 - $638,000
About This Home
This home is located at 146 Providence Ave, Riverside, RI 02915 and is currently estimated at $500,783, approximately $357 per square foot. 146 Providence Ave is a home located in Providence County with nearby schools including East Providence High School, St Mary Academy-Bay View, and St Luke Elementary School.
Ownership History
We collect this data history from publicly available records. To have your information removed, we recommend requesting removal directly through your county’s website.
Purchase Details
Home Financials for this Owner
Home Financials are based on the most recent Mortgage that was taken out on this home.Purchase Details
Home Values in the Area
Average Home Value in this Area
Purchase History
We collect this data history from publicly available records. To have your information removed, we recommend requesting removal directly through your county’s website.
| Date | Buyer | Sale Price | Title Company |
|---|---|---|---|
| $109,000 | -- | ||
| $116,000 | -- |
Mortgage History
We collect this data history from publicly available records. To have your information removed, we recommend requesting removal directly through your county’s website.
| Date | Status | Borrower | Loan Amount |
|---|---|---|---|
| Open | $45,000 | ||
| Open | $259,000 | ||
| Closed | $175,610 | ||
| Closed | $126,426 | ||
| Closed | $39,139 | ||
| Closed | $23,000 | ||
| Closed | $145,000 | ||
| Closed | $111,150 |
Tax History
We collect this data history from publicly available records. To have your information removed, we recommend requesting removal directly through your county’s website.
| Year | Tax Paid | Tax Assessment Tax Assessment Total Assessment is a certain percentage of the fair market value that is determined by local assessors to be the total taxable value of land and additions on the property. | Land | Improvement |
|---|---|---|---|---|
| 2025 | $4,954 | $379,000 | $102,000 | $277,000 |
| 2024 | $4,930 | $321,600 | $85,000 | $236,600 |
| 2023 | $4,747 | $321,600 | $85,000 | $236,600 |
| 2022 | $4,580 | $209,500 | $55,100 | $154,400 |
| 2021 | $4,504 | $209,500 | $54,400 | $155,100 |
| 2020 | $4,314 | $209,500 | $54,400 | $155,100 |
| 2019 | $4,194 | $209,500 | $54,400 | $155,100 |
| 2018 | $3,901 | $170,500 | $36,700 | $133,800 |
| 2017 | $3,814 | $170,500 | $36,700 | $133,800 |
| 2016 | $3,795 | $170,500 | $36,700 | $133,800 |
| 2015 | $3,677 | $160,200 | $36,400 | $123,800 |
| 2014 | $3,677 | $160,200 | $36,400 | $123,800 |
Map
- 155 Stanton Ave Unit 157
- 104 Stanton Ave
- 13 Harding Ave
- 140 Beacon Park Dr
- 59 Booth Ave
- 63 Shore Rd
- 18 Glen St
- 26 Peach Orchard Dr
- 73 Lindy Ave
- 0 Carousel Dr
- 72 Allen Ave
- 1 Sabin St
- 878 Bullocks Point Ave
- 37 Planet Ave
- 25 Hoppin Ave
- 27 Hoppin Ave
- 236 Becker Ave
- 916 Bullocks Pt Ave
- 33 Jefferson Ave
- 45 Metropolitan Park Dr
- 151 Providence Ave
- 28 Cove St
- 149 Providence Ave
- 200 Earl Ave
- 16 Cove St
- 144 Providence Ave
- 164 Providence Ave
- 145 Providence Ave
- 140 Providence Ave
- 203 Earl Ave Unit 205
- 502 Bullocks Point Ave
- 15 Cove St
- 175 Providence Ave
- 143 Providence Ave
- 510 Bullocks Point Ave
- 89 Hartford Ave
- 31 Cove St
- 44 Cove St
- 85 Hartford Ave
- 64 Sherman St
Ask me questions while you tour the home.