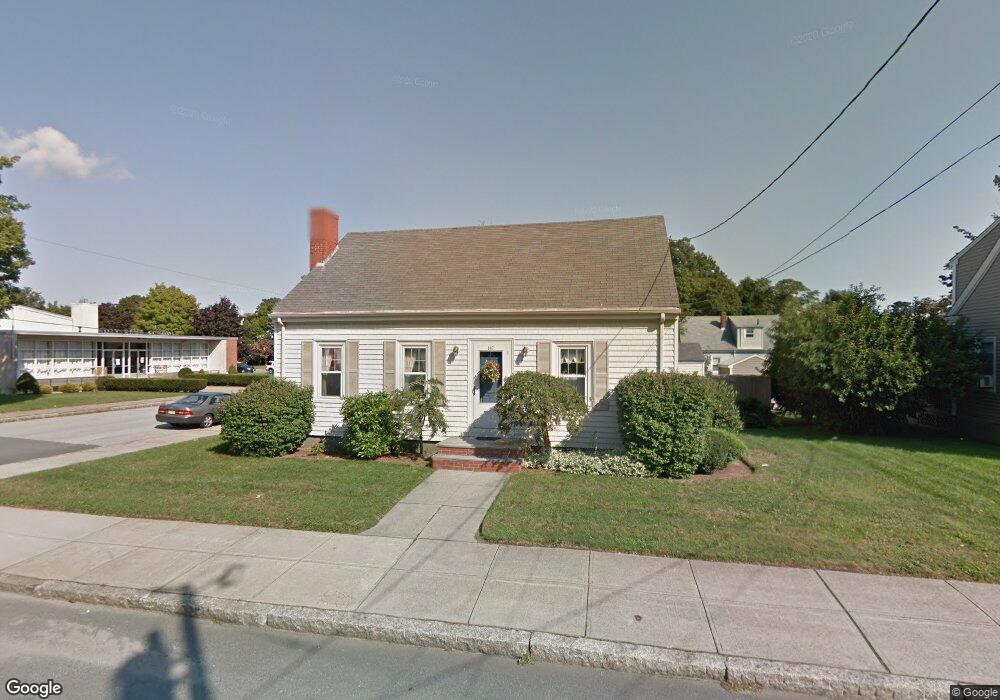
147 Read St Fall River, MA 02720
Highlands-Fall River NeighborhoodEstimated Value: $432,674 - $474,000
About This Home
This home is located at 147 Read St, Fall River, MA 02720 and is currently estimated at $450,919, approximately $278 per square foot. 147 Read St is a home located in Bristol County with nearby schools including Spencer Borden Elementary School, Morton Middle School, and B M C Durfee High School.
Ownership History
We collect this data history from publicly available records. To have your information removed, we recommend requesting removal directly through your county’s website.
Purchase Details
Home Values in the Area
Average Home Value in this Area
Purchase History
We collect this data history from publicly available records. To have your information removed, we recommend requesting removal directly through your county’s website.
| Date | Buyer | Sale Price | Title Company |
|---|---|---|---|
| $52,000 | -- |
Mortgage History
We collect this data history from publicly available records. To have your information removed, we recommend requesting removal directly through your county’s website.
| Date | Status | Borrower | Loan Amount |
|---|---|---|---|
| Open | $12,000 | ||
| Closed | $17,000 |
Tax History
We collect this data history from publicly available records. To have your information removed, we recommend requesting removal directly through your county’s website.
| Year | Tax Paid | Tax Assessment Tax Assessment Total Assessment is a certain percentage of the fair market value that is determined by local assessors to be the total taxable value of land and additions on the property. | Land | Improvement |
|---|---|---|---|---|
| 2025 | $3,912 | $341,700 | $116,000 | $225,700 |
| 2024 | $3,722 | $323,900 | $113,700 | $210,200 |
| 2023 | $3,800 | $309,700 | $102,400 | $207,300 |
| 2022 | $3,406 | $269,900 | $96,600 | $173,300 |
| 2021 | $3,251 | $235,100 | $92,300 | $142,800 |
| 2020 | $3,046 | $210,800 | $88,100 | $122,700 |
| 2019 | $3,068 | $210,400 | $92,100 | $118,300 |
| 2018 | $2,942 | $201,200 | $90,600 | $110,600 |
| 2017 | $2,789 | $199,200 | $90,600 | $108,600 |
| 2016 | $2,704 | $198,400 | $95,400 | $103,000 |
| 2015 | $2,583 | $197,500 | $95,400 | $102,100 |
| 2014 | $2,485 | $197,500 | $95,400 | $102,100 |
Map
- 435-437 Stetson St
- 45 Read St
- 65-67 Farnham St
- 301 Madison St
- 47 Summerfield St
- 51 Summerfield St
- 615 Robeson St
- 618 Robeson St
- 1244 President Ave
- 1231 Robeson St
- 37 Shawmut St
- 956 Maple St
- 79 Woodlawn St
- 878 Highland Ave
- 36 Mcclure Place
- 152 Harding St
- 434 Linden St Unit 2
- 434 Linden St Unit 4
- 554 Madison St
- 630 Maple St
- 412 Stetson St
- 420 Stetson St
- 396 Stetson St Unit 2
- 394 Stetson St
- 101 Read St
- 111 Read St
- 87 Read St
- 407 Stetson St
- 434 Stetson St
- 384 Stetson St
- 384 Stetson St Unit 2
- 121 Read St
- 425 Stetson St Unit 427
- 65 Read St
- 374 Stetson St
- 374 Stetson St Unit 2
- 399 Stetson St
- 372 Stetson St
- 446 Stetson St
- 435 Stetson St Unit 437
Ask me questions while you tour the home.