1479 Wilbraham Rd Springfield, MA 01119
Sixteen Acres NeighborhoodEstimated Value: $292,000 - $300,000
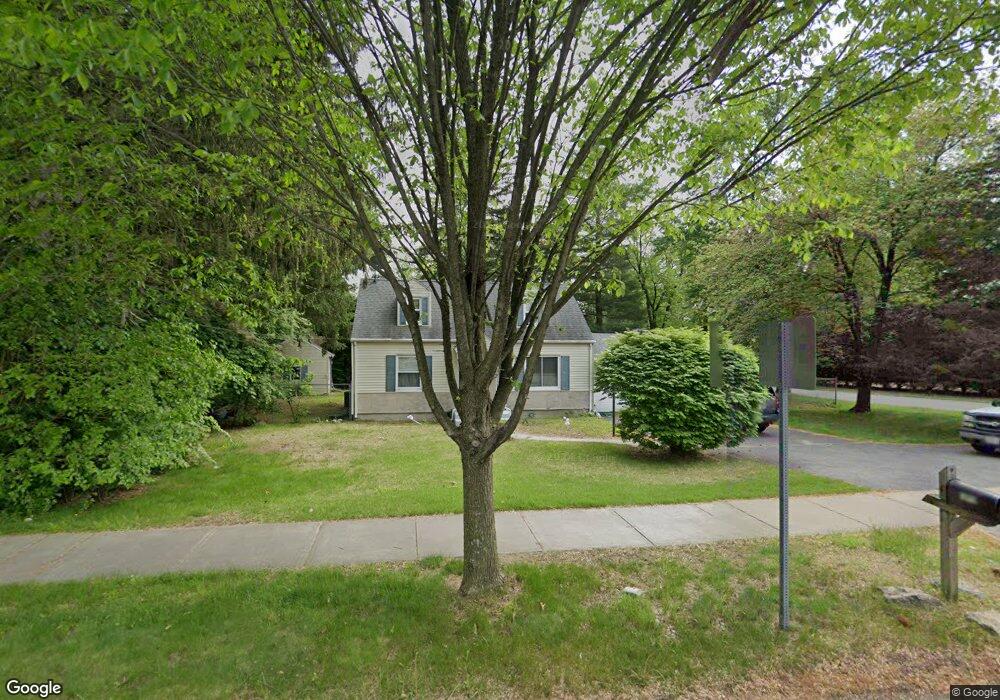
About This Home
This home is located at 1479 Wilbraham Rd, Springfield, MA 01119 and is currently estimated at $297,536, approximately $250 per square foot. 1479 Wilbraham Rd is a home located in Hampden County with nearby schools including Glickman Elementary, John J Duggan Middle, and Springfield High School of Science and Technology.
Ownership History
We collect this data history from publicly available records. To have your information removed, we recommend requesting removal directly through your county’s website.
Purchase Details
Home Values in the Area
Average Home Value in this Area
Purchase History
We collect this data history from publicly available records. To have your information removed, we recommend requesting removal directly through your county’s website.
| Date | Buyer | Sale Price | Title Company |
|---|---|---|---|
| $63,000 | -- |
Mortgage History
We collect this data history from publicly available records. To have your information removed, we recommend requesting removal directly through your county’s website.
| Date | Status | Borrower | Loan Amount |
|---|---|---|---|
| Open | $183,000 | ||
| Closed | $41,000 | ||
| Closed | $30,000 | ||
| Closed | $25,110 | ||
| Closed | $25,000 | ||
| Closed | $21,141 |
Tax History
We collect this data history from publicly available records. To have your information removed, we recommend requesting removal directly through your county’s website.
| Year | Tax Paid | Tax Assessment Tax Assessment Total Assessment is a certain percentage of the fair market value that is determined by local assessors to be the total taxable value of land and additions on the property. | Land | Improvement |
|---|---|---|---|---|
| 2025 | $3,506 | $223,600 | $52,200 | $171,400 |
| 2024 | $3,310 | $206,100 | $52,200 | $153,900 |
| 2023 | $3,154 | $185,000 | $49,700 | $135,300 |
| 2022 | $3,064 | $162,800 | $49,700 | $113,100 |
| 2021 | $2,880 | $152,400 | $45,200 | $107,200 |
| 2020 | $2,935 | $150,300 | $45,200 | $105,100 |
| 2019 | $2,716 | $138,000 | $45,200 | $92,800 |
| 2018 | $2,826 | $143,600 | $45,200 | $98,400 |
| 2017 | $2,593 | $131,900 | $42,000 | $89,900 |
| 2016 | $2,465 | $125,400 | $42,000 | $83,400 |
| 2015 | $2,410 | $122,500 | $42,000 | $80,500 |
Map
- 0 Catalpa Terrace
- 15 Ashland Ave
- 1491 Wilbraham Rd
- 0 Caltalpa Terrace Unit 71196617
- 1459 Wilbraham Rd
- 0 Ashland Ave
- 16 Ashland Ave
- 27 Ashland Ave
- 20 Birchland Ave
- 1480 Wilbraham Rd
- 28 Ashland Ave
- 1500 Wilbraham Rd
- 1455 Wilbraham Rd
- 33 Ashland Ave
- 1468 Wilbraham Rd
- 5 Birchland Ave
- 30 Birchland Ave
- 1506 Wilbraham Rd
- 17 Jonquil Dr
- 15 Birchland Ave
Ask me questions while you tour the home.