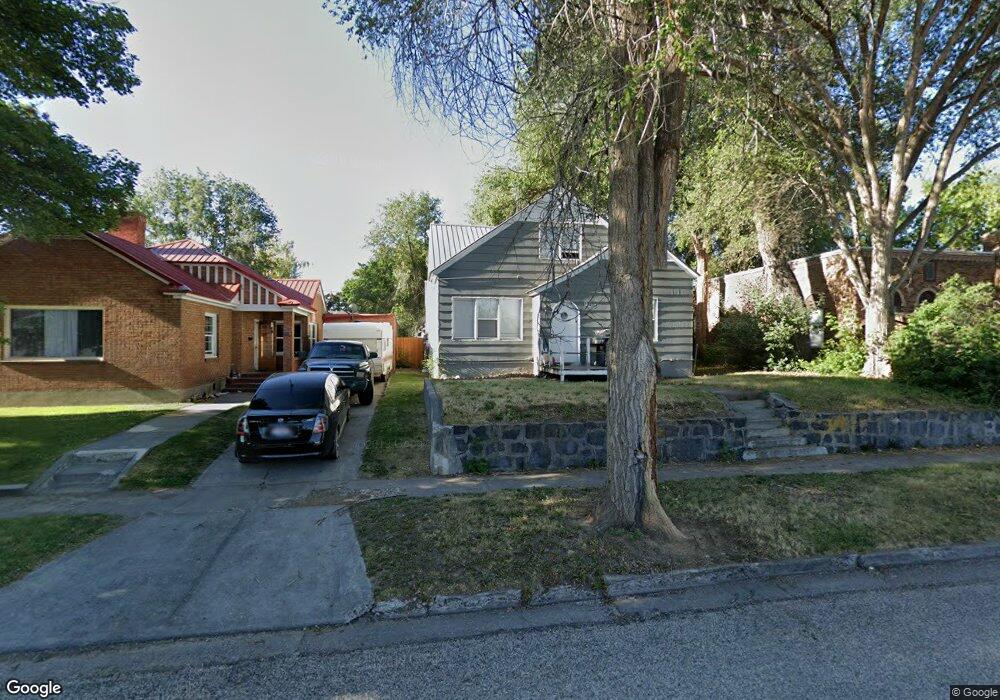
148 7th St Idaho Falls, ID 83401
Estimated Value: $361,000 - $472,000
4
Beds
4
Baths
2,884
Sq Ft
$135/Sq Ft
Est. Value
About This Home
This home is located at 148 7th St, Idaho Falls, ID 83401 and is currently estimated at $388,779, approximately $134 per square foot. 148 7th St is a home located in Bonneville County with nearby schools including Linden Park Elementary School, Taylorview Middle School, and Idaho Falls Senior High School.
Ownership History
Date
Name
Owned For
Owner Type
Purchase Details
Closed on
Dec 14, 2005
Sold by
Heredia Victor and Heredia Nicole
Bought by
Schlunegger Kyle A and Schlunegger Susan M
Current Estimated Value
Home Financials for this Owner
Home Financials are based on the most recent Mortgage that was taken out on this home.
Original Mortgage
$101,500
Outstanding Balance
$56,992
Interest Rate
6.35%
Mortgage Type
New Conventional
Estimated Equity
$331,787
Create a Home Valuation Report for This Property
The Home Valuation Report is an in-depth analysis detailing your home's value as well as a comparison with similar homes in the area
Purchase History
| Date | Buyer | Sale Price | Title Company |
|---|---|---|---|
| Schlunegger Kyle A | -- | -- |
Source: Public Records
Mortgage History
| Date | Status | Borrower | Loan Amount |
|---|---|---|---|
| Open | Schlunegger Kyle A | $101,500 |
Source: Public Records
Tax History
| Year | Tax Paid | Tax Assessment Tax Assessment Total Assessment is a certain percentage of the fair market value that is determined by local assessors to be the total taxable value of land and additions on the property. | Land | Improvement |
|---|---|---|---|---|
| 2025 | $3,988 | $429,876 | $64,078 | $365,798 |
| 2024 | $3,826 | $404,640 | $44,180 | $360,460 |
| 2023 | $3,875 | $383,330 | $44,180 | $339,150 |
| 2022 | $4,205 | $335,311 | $30,141 | $305,170 |
| 2021 | $2,357 | $229,071 | $30,141 | $198,930 |
| 2019 | $2,659 | $144,885 | $25,125 | $119,760 |
| 2018 | $2,465 | $141,659 | $22,859 | $118,800 |
| 2017 | $2,310 | $124,405 | $16,625 | $107,780 |
| 2016 | $2,235 | $117,342 | $15,102 | $102,240 |
| 2015 | $2,222 | $112,222 | $15,102 | $97,120 |
| 2014 | $58,682 | $112,222 | $15,102 | $97,120 |
| 2013 | $2,349 | $123,021 | $15,101 | $107,920 |
Source: Public Records
Map
Nearby Homes
Your Personal Tour Guide
Ask me questions while you tour the home.