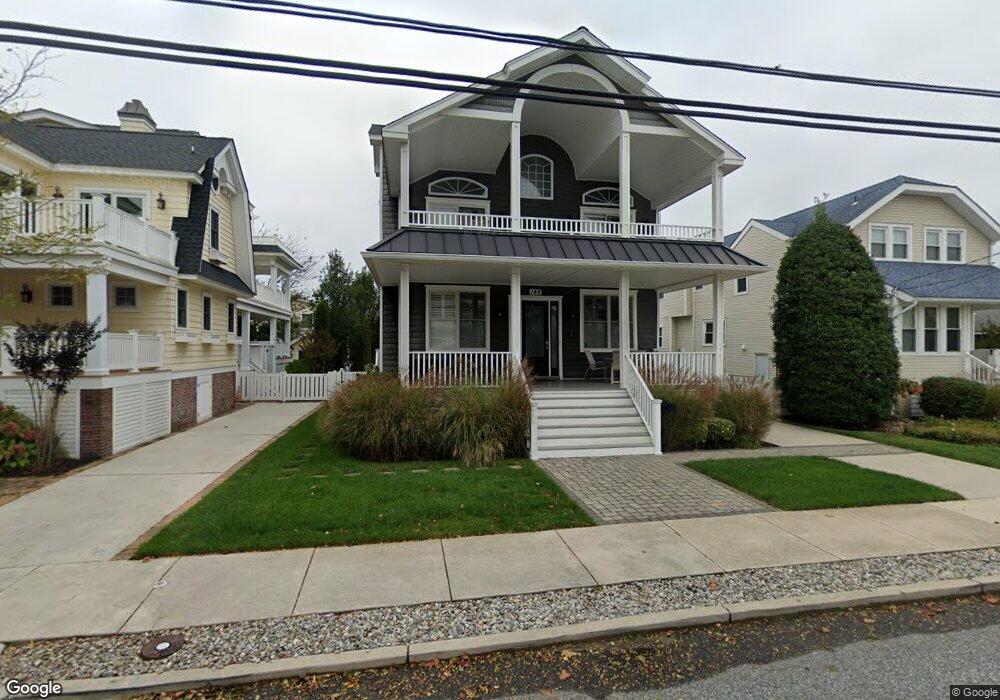
149 13th St Avalon, NJ 08202
Estimated Value: $2,977,000 - $3,582,000
Studio
--
Bath
2,922
Sq Ft
$1,099/Sq Ft
Est. Value
About This Home
This home is located at 149 13th St, Avalon, NJ 08202 and is currently estimated at $3,212,484, approximately $1,099 per square foot. 149 13th St is a home with nearby schools including Avalon Elementary School.
Ownership History
Date
Name
Owned For
Owner Type
Purchase Details
Closed on
Jan 22, 2018
Sold by
Riggins Steven D
Bought by
Riggins Steven D and Nicholson Cheryl L
Current Estimated Value
Purchase Details
Closed on
Jan 30, 2012
Sold by
5110 Landis Avenue Llc
Bought by
Riggins Steven D
Home Financials for this Owner
Home Financials are based on the most recent Mortgage that was taken out on this home.
Original Mortgage
$900,000
Interest Rate
3.38%
Mortgage Type
New Conventional
Create a Home Valuation Report for This Property
The Home Valuation Report is an in-depth analysis detailing your home's value as well as a comparison with similar homes in the area
Home Values in the Area
Average Home Value in this Area
Purchase History
| Date | Buyer | Sale Price | Title Company |
|---|---|---|---|
| Riggins Steven D | -- | -- | |
| Riggins Steven D | $1,350,000 | Landis Title Corporation |
Source: Public Records
Mortgage History
| Date | Status | Borrower | Loan Amount |
|---|---|---|---|
| Previous Owner | Riggins Steven D | $900,000 |
Source: Public Records
Tax History
| Year | Tax Paid | Tax Assessment Tax Assessment Total Assessment is a certain percentage of the fair market value that is determined by local assessors to be the total taxable value of land and additions on the property. | Land | Improvement |
|---|---|---|---|---|
| 2025 | $8,994 | $1,464,800 | $800,000 | $664,800 |
| 2024 | $8,994 | $1,464,800 | $800,000 | $664,800 |
| 2023 | $8,921 | $1,464,800 | $800,000 | $664,800 |
| 2022 | $8,320 | $1,464,800 | $800,000 | $664,800 |
| 2021 | $8,012 | $1,464,800 | $800,000 | $664,800 |
| 2020 | $7,705 | $1,464,800 | $800,000 | $664,800 |
| 2019 | $7,470 | $1,464,800 | $800,000 | $664,800 |
| 2018 | $7,148 | $1,464,800 | $800,000 | $664,800 |
| 2017 | $7,137 | $1,283,600 | $700,000 | $583,600 |
| 2016 | $7,060 | $1,283,600 | $700,000 | $583,600 |
| 2015 | $6,944 | $1,283,600 | $700,000 | $583,600 |
| 2014 | $6,867 | $1,283,600 | $700,000 | $583,600 |
Source: Public Records
Map
Nearby Homes
Your Personal Tour Guide
Ask me questions while you tour the home.