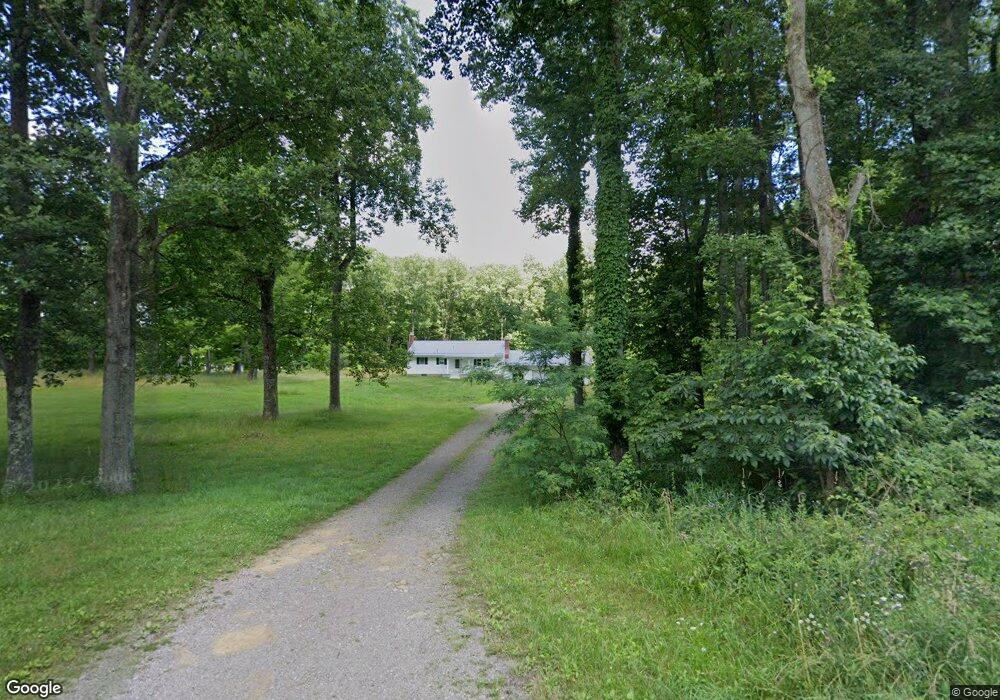
149 Flanigan Rd Confluence, PA 15424
Henry Clay NeighborhoodEstimated Value: $202,343 - $363,000
2
Beds
3
Baths
1,316
Sq Ft
$229/Sq Ft
Est. Value
About This Home
This home is located at 149 Flanigan Rd, Confluence, PA 15424 and is currently estimated at $301,336, approximately $228 per square foot. 149 Flanigan Rd is a home located in Fayette County with nearby schools including Uniontown Area Senior High School.
Ownership History
Date
Name
Owned For
Owner Type
Purchase Details
Closed on
Jan 1, 1968
Bought by
Leasure George E and Leasure Sharon K
Current Estimated Value
Create a Home Valuation Report for This Property
The Home Valuation Report is an in-depth analysis detailing your home's value as well as a comparison with similar homes in the area
Home Values in the Area
Average Home Value in this Area
Purchase History
| Date | Buyer | Sale Price | Title Company |
|---|---|---|---|
| Leasure George E | -- | -- |
Source: Public Records
Tax History
| Year | Tax Paid | Tax Assessment Tax Assessment Total Assessment is a certain percentage of the fair market value that is determined by local assessors to be the total taxable value of land and additions on the property. | Land | Improvement |
|---|---|---|---|---|
| 2025 | $1,011 | $39,510 | $14,650 | $24,860 |
| 2024 | $964 | $39,510 | $14,650 | $24,860 |
| 2023 | $1,928 | $39,510 | $14,650 | $24,860 |
| 2022 | $1,928 | $39,510 | $14,650 | $24,860 |
| 2021 | $1,928 | $39,510 | $14,650 | $24,860 |
| 2020 | $1,884 | $39,510 | $14,650 | $24,860 |
| 2019 | $1,731 | $39,510 | $14,650 | $24,860 |
| 2018 | $1,638 | $39,510 | $14,650 | $24,860 |
| 2017 | $1,638 | $39,510 | $14,650 | $24,860 |
| 2016 | -- | $39,510 | $14,650 | $24,860 |
| 2015 | -- | $39,510 | $14,650 | $24,860 |
| 2014 | -- | $79,020 | $29,300 | $49,720 |
Source: Public Records
Map
Nearby Homes
- 0 Flanigan Rd
- 2711 Lakeview Rd
- 341 Taylor Rd
- 629 River Rd
- 626 Sterner St
- 305 Abram St
- 447 Lake Side Rd
- 833 Oden St
- #5 & 7 Laurel Rd
- 159 Cedar Rd
- 631 Meyers St
- 842 Anderson St
- 230 Locust Rd
- 171 Mae West Rd
- 391 Sarvest Rd
- Lot 32 Braddocks Run Rd
- 0 Klondike Rd Unit 22177073
- 0 Klondike Rd Unit 22177082
- 0 Klondike Rd Unit 22177074
- Lot 6 Klondike Rd
- 138 Flanigan Rd
- 148 Parnell Rd
- 158 Flanigan Rd
- 153 Flanigan Rd
- 132 Flanigan Rd
- 120 Flanigan Rd
- 129 Flanigan Rd
- 104 Big Bend Rd
- 184 Flanigan Rd
- 182 Flanigan Rd
- 116 Flanigan Rd
- 112 Big Bend Rd
- 113 Flanigan Rd
- 127 Big Bend Rd
- 115 Flanigan Rd
- 190 Flanigan Rd
- 146 Big Bend Rd
- 112 Flanigan Rd
- 144 Big Bend Rd
- 358 Parnell Rd
Your Personal Tour Guide
Ask me questions while you tour the home.