15 1st St Unit 1 Salisbury, MA 01952
Estimated Value: $1,143,000 - $1,645,000
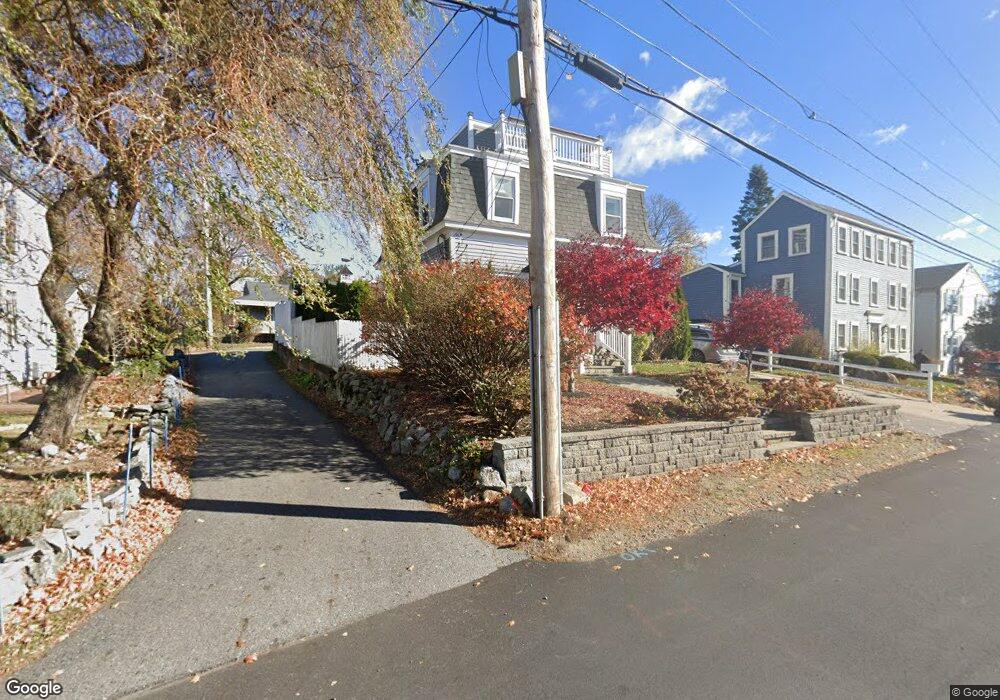
About This Home
This home is located at 15 1st St Unit 1, Salisbury, MA 01952 and is currently estimated at $1,339,903, approximately $647 per square foot. 15 1st St Unit 1 is a home located in Essex County with nearby schools including Triton Regional High School, River Valley Charter School, and Immaculate Conception School.
Ownership History
We collect this data history from publicly available records. To have your information removed, we recommend requesting removal directly through your county’s website.
Purchase Details
Home Financials for this Owner
Home Financials are based on the most recent Mortgage that was taken out on this home.Purchase Details
Home Financials for this Owner
Home Financials are based on the most recent Mortgage that was taken out on this home.Purchase Details
Home Values in the Area
Average Home Value in this Area
Purchase History
We collect this data history from publicly available records. To have your information removed, we recommend requesting removal directly through your county’s website.
| Date | Buyer | Sale Price | Title Company |
|---|---|---|---|
| $832,000 | None Available | ||
| $505,000 | -- | ||
| $245,000 | -- |
Mortgage History
We collect this data history from publicly available records. To have your information removed, we recommend requesting removal directly through your county’s website.
| Date | Status | Borrower | Loan Amount |
|---|---|---|---|
| Open | $1,135,900 | ||
| Previous Owner | $275,000 | ||
| Previous Owner | $395,000 | ||
| Previous Owner | $100,000 |
Tax History
We collect this data history from publicly available records. To have your information removed, we recommend requesting removal directly through your county’s website.
| Year | Tax Paid | Tax Assessment Tax Assessment Total Assessment is a certain percentage of the fair market value that is determined by local assessors to be the total taxable value of land and additions on the property. | Land | Improvement |
|---|---|---|---|---|
| 2025 | $10,711 | $1,062,600 | $544,900 | $517,700 |
| 2024 | $10,799 | $1,033,400 | $544,900 | $488,500 |
| 2023 | $9,024 | $835,600 | $396,300 | $439,300 |
| 2022 | $8,354 | $749,900 | $327,000 | $422,900 |
| 2021 | $7,861 | $698,100 | $311,400 | $386,700 |
| 2020 | $6,649 | $580,200 | $311,400 | $268,800 |
| 2019 | $6,569 | $553,900 | $307,700 | $246,200 |
| 2018 | $6,398 | $543,100 | $342,100 | $201,000 |
| 2017 | $6,080 | $510,100 | $283,100 | $227,000 |
| 2016 | $5,788 | $496,000 | $280,400 | $215,600 |
| 2015 | $5,873 | $499,800 | $213,200 | $286,600 |
Map
- 157 Bridge Rd
- 30-32 Water St Unit 5
- 2 Elbow Ln Unit A
- 58 Merrimac St Unit 3-5
- 126 Merrimac St Unit 9
- 150 Merrimac St Unit I
- 17 Federal St
- 5 Boardman St Unit 5
- 32 Market St
- 4 Olive St
- 31 Olive St Unit 31
- 44 Washington St Unit A
- 33 Merrill St
- 105 State St Unit 102
- 105 State St Unit 302
- 105 State St Unit 201
- 8 Milk St Unit B
- 11 Purchase St
- 8 Vernon Ct
- 28 Dove St Unit 2
Ask me questions while you tour the home.