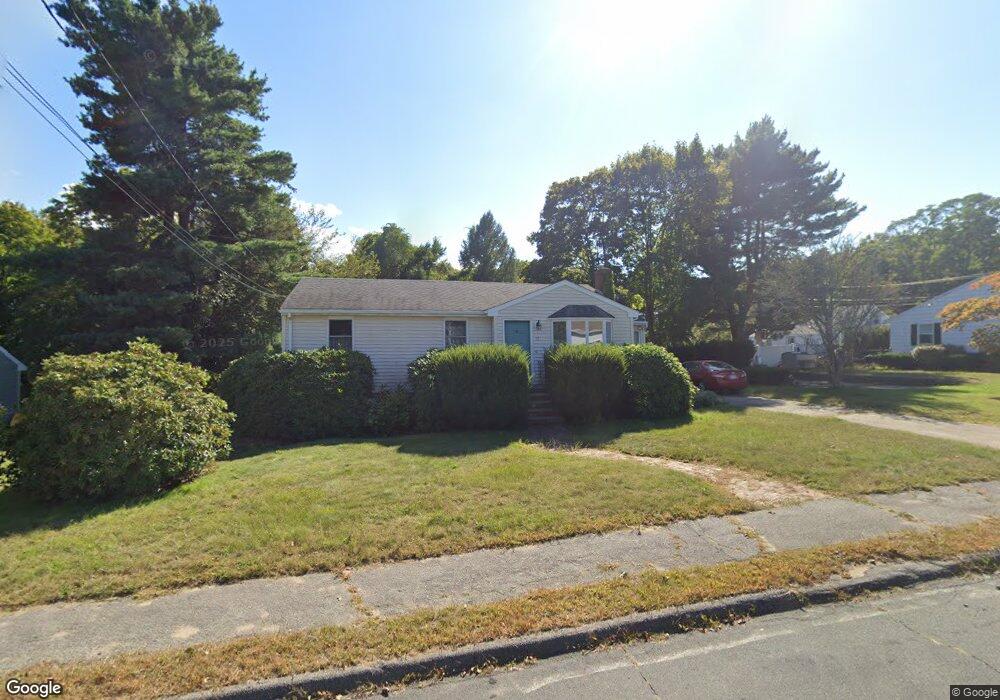
15 Andersen Rd Braintree, MA 02184
North Braintree NeighborhoodEstimated Value: $625,000 - $710,000
3
Beds
1
Bath
1,044
Sq Ft
$650/Sq Ft
Est. Value
About This Home
This home is located at 15 Andersen Rd, Braintree, MA 02184 and is currently estimated at $679,028, approximately $650 per square foot. 15 Andersen Rd is a home located in Norfolk County with nearby schools including Braintree High School, Sacred Heart Elementary School, and Thayer Academy.
Ownership History
Date
Name
Owned For
Owner Type
Purchase Details
Closed on
Dec 7, 1987
Sold by
Donofrio Ralph S
Bought by
Ewing Joan L
Current Estimated Value
Home Financials for this Owner
Home Financials are based on the most recent Mortgage that was taken out on this home.
Original Mortgage
$30,000
Interest Rate
11.27%
Mortgage Type
Purchase Money Mortgage
Create a Home Valuation Report for This Property
The Home Valuation Report is an in-depth analysis detailing your home's value as well as a comparison with similar homes in the area
Home Values in the Area
Average Home Value in this Area
Purchase History
| Date | Buyer | Sale Price | Title Company |
|---|---|---|---|
| Ewing Joan L | $158,500 | -- |
Source: Public Records
Mortgage History
| Date | Status | Borrower | Loan Amount |
|---|---|---|---|
| Closed | Ewing Joan L | $30,000 |
Source: Public Records
Tax History
| Year | Tax Paid | Tax Assessment Tax Assessment Total Assessment is a certain percentage of the fair market value that is determined by local assessors to be the total taxable value of land and additions on the property. | Land | Improvement |
|---|---|---|---|---|
| 2025 | $6,141 | $615,300 | $399,000 | $216,300 |
| 2024 | $5,442 | $574,100 | $362,300 | $211,800 |
| 2023 | $5,116 | $524,200 | $325,500 | $198,700 |
| 2022 | $4,902 | $492,700 | $294,000 | $198,700 |
| 2021 | $4,489 | $451,200 | $265,700 | $185,500 |
| 2020 | $4,210 | $427,000 | $241,500 | $185,500 |
| 2019 | $3,998 | $396,200 | $231,000 | $165,200 |
| 2018 | $3,885 | $368,600 | $210,000 | $158,600 |
| 2017 | $3,846 | $358,100 | $199,500 | $158,600 |
| 2016 | $3,773 | $343,600 | $189,000 | $154,600 |
| 2015 | $3,455 | $312,100 | $157,500 | $154,600 |
| 2014 | $3,252 | $284,800 | $151,200 | $133,600 |
Source: Public Records
Map
Nearby Homes
- 7 Del's Way
- 18 Royal Lake Dr Unit 3
- 14 Sumner Ave
- 15 Calvin St
- 83 Franklin St
- 87 Walnut St
- 6 Franklin St
- 20 Blossom Rd
- 5 Woodsum Dr Unit 12
- 77 French Ave
- 80 Lake St
- 35 Armstrong Cir
- 632 Washington St Unit G5
- 491 Washington St Unit 1
- 145 Hancock St Unit 307
- 145 Hancock St Unit 201
- 469-471 Washington St
- 21 Barstow Dr
- 18 Howie Rd
- 63 Dickerman Ln
Your Personal Tour Guide
Ask me questions while you tour the home.