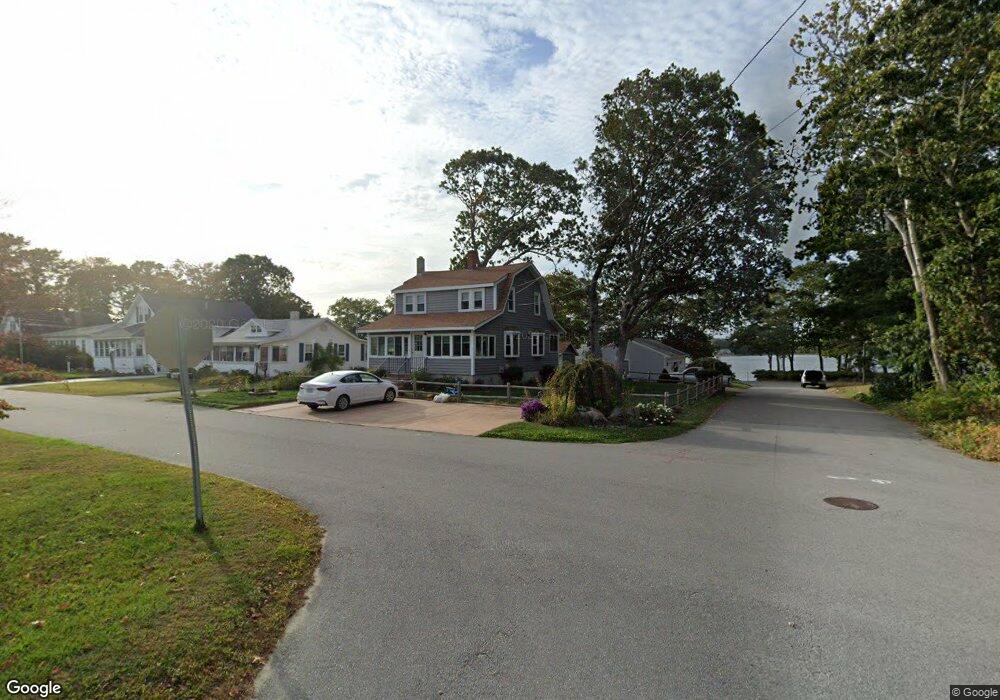
15 Ash St Wareham, MA 02571
Estimated Value: $408,000 - $515,000
3
Beds
2
Baths
1,440
Sq Ft
$333/Sq Ft
Est. Value
About This Home
This home is located at 15 Ash St, Wareham, MA 02571 and is currently estimated at $479,028, approximately $332 per square foot. 15 Ash St is a home located in Plymouth County.
Ownership History
Date
Name
Owned For
Owner Type
Purchase Details
Closed on
May 12, 2022
Sold by
Burke Debra L
Bought by
Burke Ft and Burke
Current Estimated Value
Purchase Details
Closed on
Aug 11, 1993
Sold by
Burke Louise F and Burke Francis J
Bought by
Burke Debra L
Home Financials for this Owner
Home Financials are based on the most recent Mortgage that was taken out on this home.
Original Mortgage
$65,000
Interest Rate
7.16%
Mortgage Type
Purchase Money Mortgage
Create a Home Valuation Report for This Property
The Home Valuation Report is an in-depth analysis detailing your home's value as well as a comparison with similar homes in the area
Purchase History
| Date | Buyer | Sale Price | Title Company |
|---|---|---|---|
| Burke Ft | -- | None Available | |
| Burke Ft | -- | None Available | |
| Burke Debra L | $75,000 | -- | |
| Burke Debra L | $75,000 | -- |
Source: Public Records
Mortgage History
| Date | Status | Borrower | Loan Amount |
|---|---|---|---|
| Previous Owner | Burke Debra L | $50,000 | |
| Previous Owner | Burke Debra L | $25,000 | |
| Previous Owner | Burke Debra L | $12,000 | |
| Previous Owner | Burke Debra L | $65,000 |
Source: Public Records
Tax History
| Year | Tax Paid | Tax Assessment Tax Assessment Total Assessment is a certain percentage of the fair market value that is determined by local assessors to be the total taxable value of land and additions on the property. | Land | Improvement |
|---|---|---|---|---|
| 2025 | $4,312 | $413,800 | $157,000 | $256,800 |
| 2024 | $4,301 | $383,000 | $120,500 | $262,500 |
| 2023 | $3,917 | $349,000 | $109,600 | $239,400 |
| 2022 | $3,917 | $297,200 | $109,600 | $187,600 |
| 2021 | $3,649 | $271,300 | $109,600 | $161,700 |
| 2020 | $3,507 | $264,500 | $109,600 | $154,900 |
| 2019 | $3,288 | $247,400 | $99,300 | $148,100 |
| 2018 | $3,097 | $227,200 | $99,300 | $127,900 |
| 2017 | $3,056 | $227,200 | $99,300 | $127,900 |
| 2016 | $2,766 | $204,400 | $90,100 | $114,300 |
| 2015 | $2,636 | $201,700 | $90,100 | $111,600 |
| 2014 | $2,797 | $217,700 | $98,300 | $119,400 |
Source: Public Records
Map
Nearby Homes
- 3 Hazel St
- 4 Ross Ave
- 10 Oak St
- 106 Circuit Ave
- 55 Minot Ave Unit 55
- 6 Allen Ave
- 15 Broadmarsh Ave
- 43 Shore Ave
- 20 Grant St
- 6 Pine St
- 6 Wildwood Ave
- 21 Bayview St
- 10 Barnes St
- 4 Mather Dr
- 3 Cranberry Grove Way Unit C
- 156 Sandwich Rd
- 124 Minot Ave Unit 1
- 0 Squaw's Path
- 110 Mayflower Ridge Dr
- 2697 Cranberry Hwy Unit 23
Your Personal Tour Guide
Ask me questions while you tour the home.