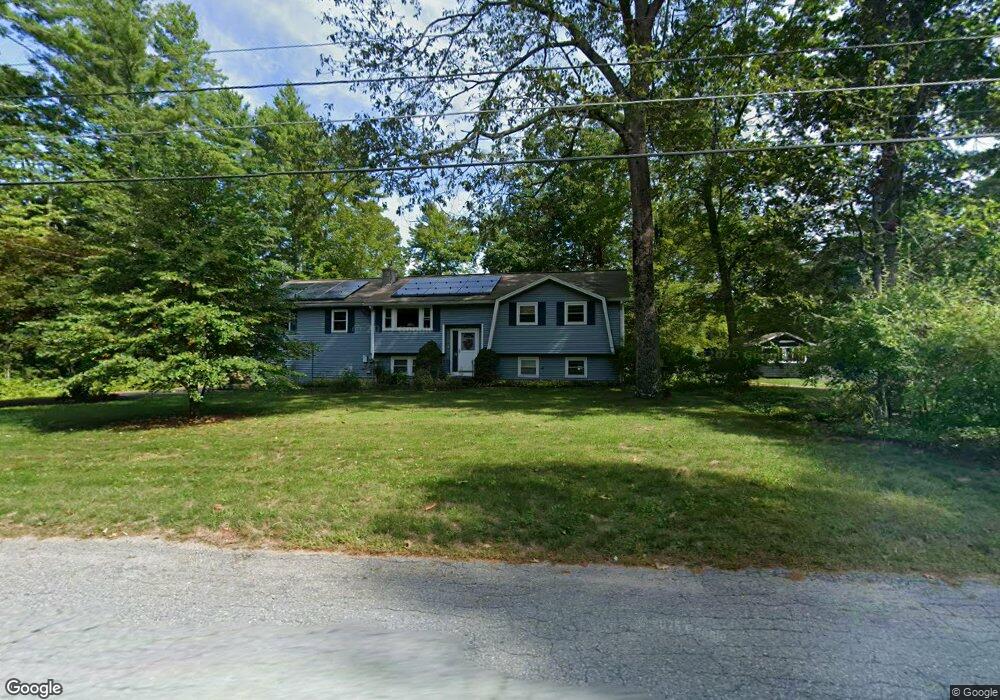
15 Bemis Rd Pepperell, MA 01463
Estimated Value: $526,000 - $569,000
4
Beds
2
Baths
1,839
Sq Ft
$296/Sq Ft
Est. Value
About This Home
This home is located at 15 Bemis Rd, Pepperell, MA 01463 and is currently estimated at $543,641, approximately $295 per square foot. 15 Bemis Rd is a home located in Middlesex County with nearby schools including North Middlesex Regional High School and Maple Dene & Moppet School.
Ownership History
Date
Name
Owned For
Owner Type
Purchase Details
Closed on
Apr 15, 2024
Sold by
Lewis James Q and Lewis Theda M
Bought by
Lewis Ft and Lewis
Current Estimated Value
Purchase Details
Closed on
Mar 31, 1989
Sold by
Buchau Richard
Bought by
Price William B
Home Financials for this Owner
Home Financials are based on the most recent Mortgage that was taken out on this home.
Original Mortgage
$136,000
Interest Rate
10.63%
Mortgage Type
Purchase Money Mortgage
Create a Home Valuation Report for This Property
The Home Valuation Report is an in-depth analysis detailing your home's value as well as a comparison with similar homes in the area
Home Values in the Area
Average Home Value in this Area
Purchase History
| Date | Buyer | Sale Price | Title Company |
|---|---|---|---|
| Lewis Ft | -- | None Available | |
| Lewis Ft | -- | None Available | |
| Price William B | $146,000 | -- | |
| Price William B | $146,000 | -- |
Source: Public Records
Mortgage History
| Date | Status | Borrower | Loan Amount |
|---|---|---|---|
| Previous Owner | Price William B | $16,000 | |
| Previous Owner | Price William B | $136,000 |
Source: Public Records
Tax History
| Year | Tax Paid | Tax Assessment Tax Assessment Total Assessment is a certain percentage of the fair market value that is determined by local assessors to be the total taxable value of land and additions on the property. | Land | Improvement |
|---|---|---|---|---|
| 2025 | $5,938 | $405,900 | $143,700 | $262,200 |
| 2024 | $5,409 | $376,900 | $130,000 | $246,900 |
| 2023 | $5,590 | $369,200 | $130,000 | $239,200 |
| 2022 | $5,222 | $304,500 | $102,600 | $201,900 |
| 2021 | $5,154 | $287,600 | $88,900 | $198,700 |
| 2020 | $4,883 | $287,600 | $88,900 | $198,700 |
| 2019 | $4,541 | $273,700 | $88,900 | $184,800 |
| 2018 | $4,176 | $254,800 | $88,900 | $165,900 |
| 2017 | $7,096 | $251,000 | $88,900 | $162,100 |
| 2016 | $3,800 | $229,900 | $88,900 | $141,000 |
| 2015 | $3,667 | $229,900 | $88,900 | $141,000 |
| 2014 | $3,564 | $224,700 | $88,900 | $135,800 |
Source: Public Records
Map
Nearby Homes
Your Personal Tour Guide
Ask me questions while you tour the home.