15 Curtis St Marblehead, MA 01945
Marblehead AreaEstimated Value: $626,000 - $890,288
About This Home
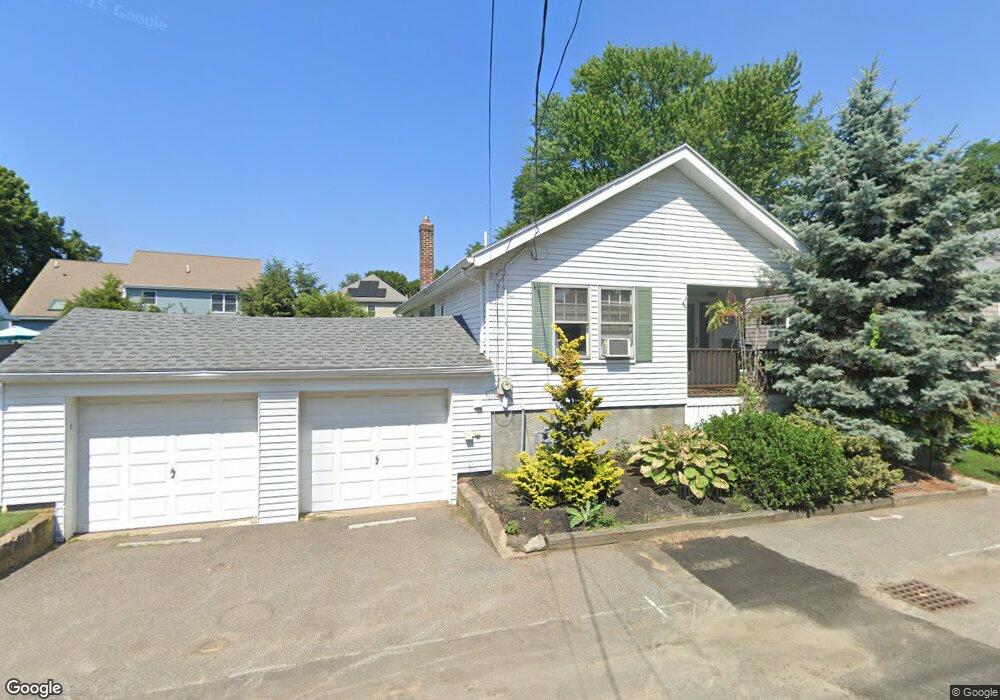
This home is located at 15 Curtis St, Marblehead, MA 01945 and is currently estimated at $770,072, approximately $783 per square foot. 15 Curtis St is a home located in Essex County with nearby schools including Marblehead High School, Marblehead Community Charter Public School, and Devereux School.
Ownership History
We collect this data history from publicly available records. To have your information removed, we recommend requesting removal directly through your county’s website.
Purchase Details
Purchase Details
Purchase Details
Home Values in the Area
Average Home Value in this Area
Purchase History
We collect this data history from publicly available records. To have your information removed, we recommend requesting removal directly through your county’s website.
| Date | Buyer | Sale Price | Title Company |
|---|---|---|---|
| $367,500 | -- | ||
| $150,000 | -- | ||
| $150,000 | -- |
Mortgage History
We collect this data history from publicly available records. To have your information removed, we recommend requesting removal directly through your county’s website.
| Date | Status | Borrower | Loan Amount |
|---|---|---|---|
| Closed | $225,000 | ||
| Closed | $144,400 | ||
| Closed | $150,000 | ||
| Previous Owner | $75,000 | ||
| Previous Owner | $102,000 | ||
| Previous Owner | $140,000 |
Tax History
We collect this data history from publicly available records. To have your information removed, we recommend requesting removal directly through your county’s website.
| Year | Tax Paid | Tax Assessment Tax Assessment Total Assessment is a certain percentage of the fair market value that is determined by local assessors to be the total taxable value of land and additions on the property. | Land | Improvement |
|---|---|---|---|---|
| 2025 | $6,903 | $762,800 | $575,400 | $187,400 |
| 2024 | $6,124 | $683,500 | $549,800 | $133,700 |
| 2023 | $6,501 | $650,100 | $524,200 | $125,900 |
| 2022 | $5,907 | $561,500 | $428,300 | $133,200 |
| 2021 | $5,661 | $543,300 | $409,100 | $134,200 |
| 2020 | $5,299 | $510,000 | $409,100 | $100,900 |
| 2019 | $5,066 | $471,700 | $370,800 | $100,900 |
| 2018 | $4,655 | $422,400 | $345,200 | $77,200 |
| 2017 | $4,229 | $384,100 | $306,900 | $77,200 |
| 2016 | $4,153 | $374,100 | $294,100 | $80,000 |
| 2015 | $4,003 | $361,300 | $281,300 | $80,000 |
| 2014 | $3,560 | $321,000 | $242,900 | $78,100 |
Map
- 24 Roosevelt Ave
- 121 Elm St Unit 2
- 6 Colonial Ct
- 83 Pleasant St Unit 3
- 66 Pleasant St Unit 2
- 58 Jersey St
- 14 Linden St
- 64 Pleasant St Unit A
- 64 Pleasant St Unit B
- 7 Bradford Ct
- 21 Shepard St
- 44 Pleasant St Unit 1
- 3 Frost Ln
- 31 Mugford St
- 126 Pleasant St
- 24 Pond St Unit 1
- 98 Evans Rd
- 10 Highland Terrace
- 20 Mechanic Square Unit 2
- 20 Mechanic Square Unit 3
Ask me questions while you tour the home.