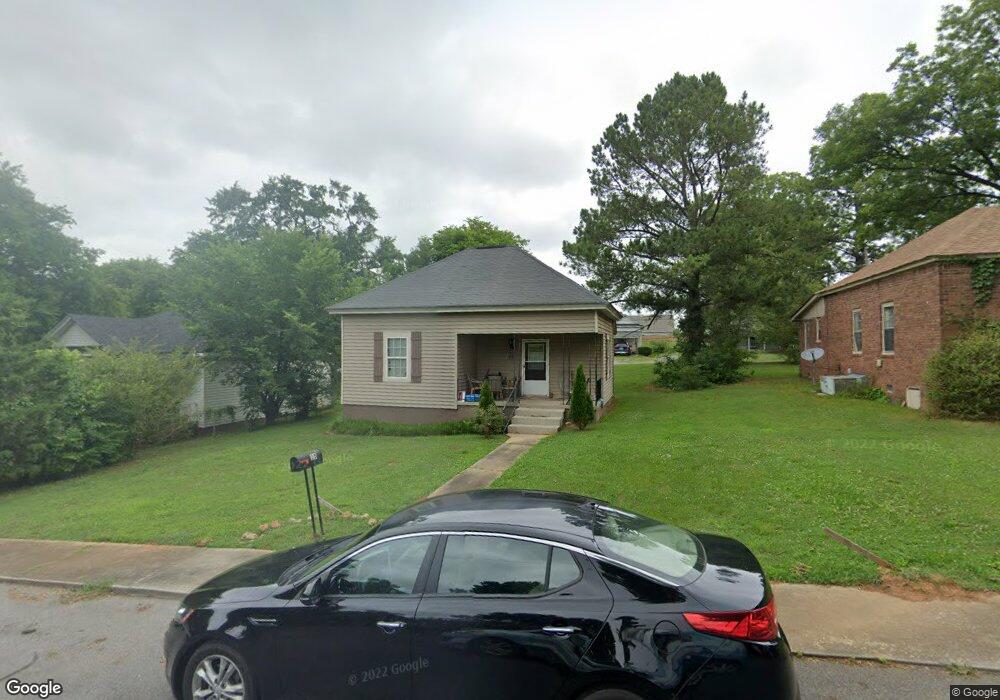
15 Defender St Cartersville, GA 30120
Estimated Value: $191,000 - $261,000
1
Bed
1
Bath
751
Sq Ft
$290/Sq Ft
Est. Value
About This Home
This home is located at 15 Defender St, Cartersville, GA 30120 and is currently estimated at $217,504, approximately $289 per square foot. 15 Defender St is a home located in Bartow County with nearby schools including Cartersville Primary School, Cartersville Elementary School, and Cartersville Middle School.
Ownership History
Date
Name
Owned For
Owner Type
Purchase Details
Closed on
Aug 7, 2020
Sold by
Gamble Shirley J
Bought by
Gamble Shirley J and Akpose Mairo
Current Estimated Value
Purchase Details
Closed on
Jul 31, 2017
Sold by
Teague Britney C
Bought by
Gamble Shirley J
Home Financials for this Owner
Home Financials are based on the most recent Mortgage that was taken out on this home.
Original Mortgage
$91,616
Interest Rate
3.88%
Mortgage Type
New Conventional
Create a Home Valuation Report for This Property
The Home Valuation Report is an in-depth analysis detailing your home's value as well as a comparison with similar homes in the area
Home Values in the Area
Average Home Value in this Area
Purchase History
We collect this data history from publicly available records. To have your information removed, we recommend requesting removal directly through your county’s website.
| Date | Buyer | Sale Price | Title Company |
|---|---|---|---|
| Gamble Shirley J | -- | -- | |
| Gamble Shirley J | $90,700 | -- |
Source: Public Records
Mortgage History
We collect this data history from publicly available records. To have your information removed, we recommend requesting removal directly through your county’s website.
| Date | Status | Borrower | Loan Amount |
|---|---|---|---|
| Previous Owner | Gamble Shirley J | $91,616 |
Source: Public Records
Tax History
| Year | Tax Paid | Tax Assessment Tax Assessment Total Assessment is a certain percentage of the fair market value that is determined by local assessors to be the total taxable value of land and additions on the property. | Land | Improvement |
|---|---|---|---|---|
| 2025 | $1,109 | $85,890 | $18,000 | $67,890 |
| 2024 | $1,109 | $83,913 | $18,000 | $65,913 |
| 2023 | $2,103 | $80,288 | $18,000 | $62,288 |
| 2022 | $1,652 | $62,491 | $18,000 | $44,491 |
| 2021 | $1,216 | $44,757 | $14,000 | $30,757 |
| 2020 | $1,094 | $38,757 | $8,000 | $30,757 |
| 2019 | $1,025 | $35,350 | $8,000 | $27,350 |
| 2018 | $1,009 | $34,568 | $8,000 | $26,568 |
| 2017 | $703 | $23,560 | $4,000 | $19,560 |
| 2016 | $714 | $23,560 | $4,000 | $19,560 |
| 2015 | $699 | $23,560 | $4,000 | $19,560 |
| 2014 | $632 | $20,800 | $4,000 | $16,800 |
| 2013 | -- | $12,680 | $4,400 | $8,280 |
Source: Public Records
Map
Nearby Homes
- 6 Defender St
- 172 Mercer Ln
- 10 Commons Way
- 4 Commons Way
- 8 Commons Way
- 6 Commons Way
- 29 Akron St
- 23 Miles Dr SE
- 13 Akron St
- 4 Miles Dr
- 12 Miles Dr SE
- 7 Litchfield Rd
- 37 Middlebrook Dr
- 14 Parr Wade Rd SE
- 17 Middlebrook Dr
- 88 Middlebrook Dr
- 73 Cotton Bend
- 100 Sylvie Dr
- 210 Clara Crossing
- 210 Clara Crossing Unit 13
Your Personal Tour Guide
Ask me questions while you tour the home.