15 Dexter Rd Marion, MA 02738
Estimated Value: $583,000 - $765,000
3
Beds
1
Bath
1,110
Sq Ft
$579/Sq Ft
Est. Value
About This Home
This home is located at 15 Dexter Rd, Marion, MA 02738 and is currently estimated at $642,738, approximately $579 per square foot. 15 Dexter Rd is a home located in Plymouth County with nearby schools including Old Rochester Regional High School and Tabor Academy.
Ownership History
Date
Name
Owned For
Owner Type
Purchase Details
Closed on
Oct 5, 2019
Sold by
Seifert Kurt J
Bought by
Int Butrick Seifert
Current Estimated Value
Purchase Details
Closed on
Jun 8, 2010
Sold by
Contant Leisha J and Seifert Leisha J
Bought by
Seifert Kurt J
Home Financials for this Owner
Home Financials are based on the most recent Mortgage that was taken out on this home.
Original Mortgage
$104,000
Interest Rate
5.12%
Mortgage Type
Purchase Money Mortgage
Purchase Details
Closed on
Feb 3, 2005
Sold by
Seifert Arthur and Seifert Rose
Bought by
Seifert Kurt J and Seifert Leisha J
Purchase Details
Closed on
Jan 29, 1962
Bought by
Seifert Kurt J
Create a Home Valuation Report for This Property
The Home Valuation Report is an in-depth analysis detailing your home's value as well as a comparison with similar homes in the area
Purchase History
We collect this data history from publicly available records. To have your information removed, we recommend requesting removal directly through your county’s website.
| Date | Buyer | Sale Price | Title Company |
|---|---|---|---|
| Int Butrick Seifert | -- | -- | |
| Seifert Kurt J | -- | -- | |
| Seifert Kurt J | -- | -- | |
| Seifert Kurt J | $7,000 | -- |
Source: Public Records
Mortgage History
We collect this data history from publicly available records. To have your information removed, we recommend requesting removal directly through your county’s website.
| Date | Status | Borrower | Loan Amount |
|---|---|---|---|
| Previous Owner | Seifert Kurt J | $104,000 |
Source: Public Records
Tax History
| Year | Tax Paid | Tax Assessment Tax Assessment Total Assessment is a certain percentage of the fair market value that is determined by local assessors to be the total taxable value of land and additions on the property. | Land | Improvement |
|---|---|---|---|---|
| 2025 | $5,547 | $595,175 | $426,275 | $168,900 |
| 2024 | $5,832 | $629,832 | $458,332 | $171,500 |
| 2023 | $6,962 | $737,483 | $589,283 | $148,200 |
| 2022 | $5,774 | $532,192 | $402,192 | $130,000 |
| 2021 | $5,394 | $476,519 | $351,919 | $124,600 |
| 2020 | $5,512 | $471,100 | $351,900 | $119,200 |
| 2019 | $5,122 | $464,400 | $351,900 | $112,500 |
| 2018 | $5,394 | $471,100 | $373,500 | $97,600 |
| 2017 | $5,302 | $464,700 | $373,500 | $91,200 |
| 2016 | $4,497 | $397,600 | $303,800 | $93,800 |
| 2015 | $4,273 | $384,600 | $303,800 | $80,800 |
Source: Public Records
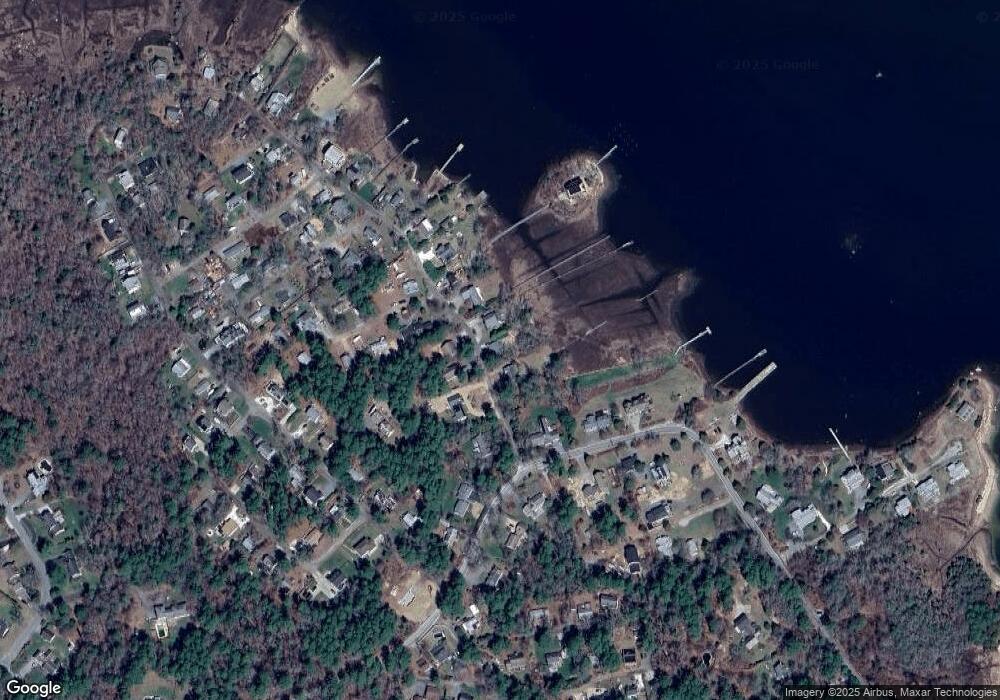
Map
Nearby Homes
- 16 Bass Point Rd
- 0 Cross Neck Rd Unit 73420524
- 0 Cross Neck Rd Unit 73466177
- 0 Cross Neck Rd Unit 73420525
- 44 Stoney Run Ln
- 492 Delano Rd
- 9 Deer Run
- 26 Washington Dr
- 37 Lincoln Hwy
- 12 Taft St
- 174 Cross Neck Rd
- 22 Fairfield Dr
- 1 Barnes St
- 36 Wankinquoah Ave
- 21 River Rd
- 192 Swifts Beach Rd
- 26 Bayview St
- 64 Rosepoint Ave
- 7 Blackhall Ct
- 4 Blackhall Ct
Your Personal Tour Guide
Ask me questions while you tour the home.