15 Duncan Ave Auburn, MA 01501
Stoneville NeighborhoodEstimated Value: $470,000 - $566,000
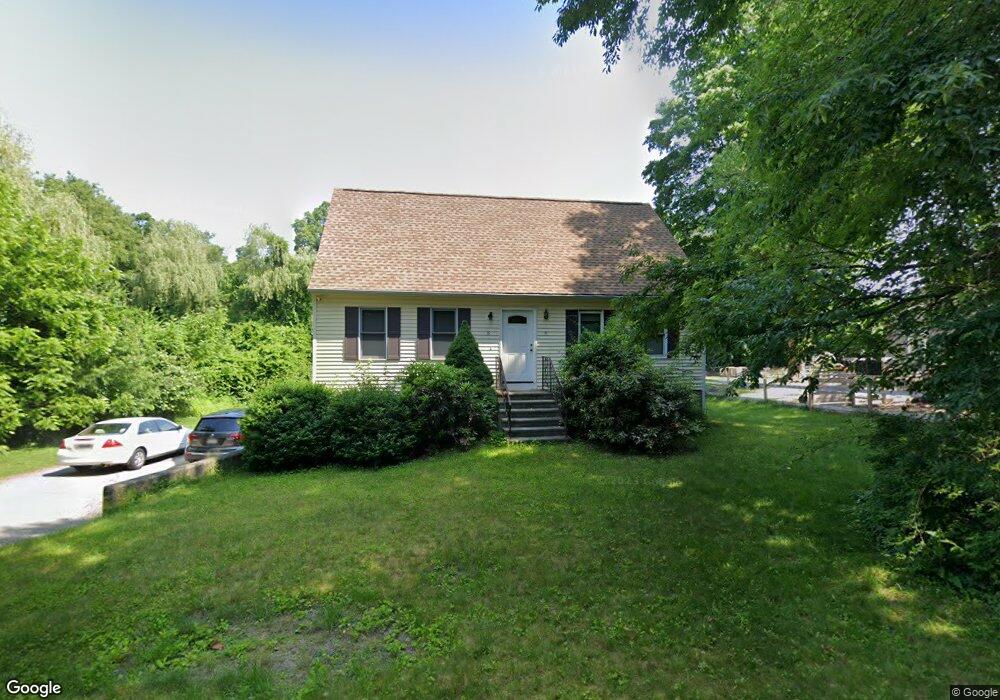
About This Home
This home is located at 15 Duncan Ave, Auburn, MA 01501 and is currently estimated at $505,551, approximately $299 per square foot. 15 Duncan Ave is a home located in Worcester County with nearby schools including Auburn Senior High School, Canterbury Street School, and Shrewsbury Montessori School - Auburn Campus.
Ownership History
We collect this data history from publicly available records. To have your information removed, we recommend requesting removal directly through your county’s website.
Purchase Details
Home Values in the Area
Average Home Value in this Area
Purchase History
We collect this data history from publicly available records. To have your information removed, we recommend requesting removal directly through your county’s website.
| Date | Buyer | Sale Price | Title Company |
|---|---|---|---|
| $220,000 | -- |
Mortgage History
We collect this data history from publicly available records. To have your information removed, we recommend requesting removal directly through your county’s website.
| Date | Status | Borrower | Loan Amount |
|---|---|---|---|
| Closed | $271,848 | ||
| Previous Owner | $40,000 | ||
| Previous Owner | $30,000 |
Tax History
We collect this data history from publicly available records. To have your information removed, we recommend requesting removal directly through your county’s website.
| Year | Tax Paid | Tax Assessment Tax Assessment Total Assessment is a certain percentage of the fair market value that is determined by local assessors to be the total taxable value of land and additions on the property. | Land | Improvement |
|---|---|---|---|---|
| 2025 | $54 | $377,300 | $127,200 | $250,100 |
| 2024 | $5,544 | $371,300 | $121,600 | $249,700 |
| 2023 | $5,450 | $343,200 | $110,500 | $232,700 |
| 2022 | $5,088 | $302,500 | $110,500 | $192,000 |
| 2021 | $4,733 | $260,900 | $97,600 | $163,300 |
| 2020 | $4,576 | $254,500 | $97,600 | $156,900 |
| 2019 | $4,627 | $251,200 | $96,600 | $154,600 |
| 2018 | $4,383 | $237,700 | $90,400 | $147,300 |
| 2017 | $4,110 | $224,100 | $82,000 | $142,100 |
| 2016 | $4,027 | $222,600 | $85,400 | $137,200 |
| 2015 | $3,808 | $220,600 | $85,400 | $135,200 |
| 2014 | $3,750 | $216,900 | $81,300 | $135,600 |
Map
- 13 Marilyn Dr
- 43 Chestnut Ave
- 39 Pinehurst Ave
- 20 Pinehurst Ave
- 99 Clover St
- 1 Eames Ave
- 23 Cowden St
- 65 Clover St
- 4 Commonwealth Ave
- 181 Boyce St
- 6 Oakwood Ave
- 25 Vinal St Unit 28
- 25 Vinal St Unit 26
- 6 Maria Ave
- 1 Rockland Road Ct
- 3 Magna Vista Dr
- 11 Hulbert Rd Unit 15
- 88 Shore Dr
- 8 Rochelle St
- 27 Lavallee Terrace
- 8 Buttonwood Ln
- 4 Duncan Ave
- 6 Buttonwood Ln
- 2 Duncan Ave
- 10 Buttonwood Ln
- 4 Buttonwood Ln
- 3 Buttonwood Ln
- 9 Duncan Ave
- 12 Buttonwood Ln
- 7 Duncan Ave
- 22 Carroll St
- 24 Carroll St
- 2 Buttonwood Ln Unit D
- 2 Buttonwood Ln Unit B
- 2 Buttonwood Ln
- 1 Buttonwood Ln
- 1 Duncan Ave
- 38 Oxford St N
- 20 Carroll St
- 9 Heard St
Ask me questions while you tour the home.