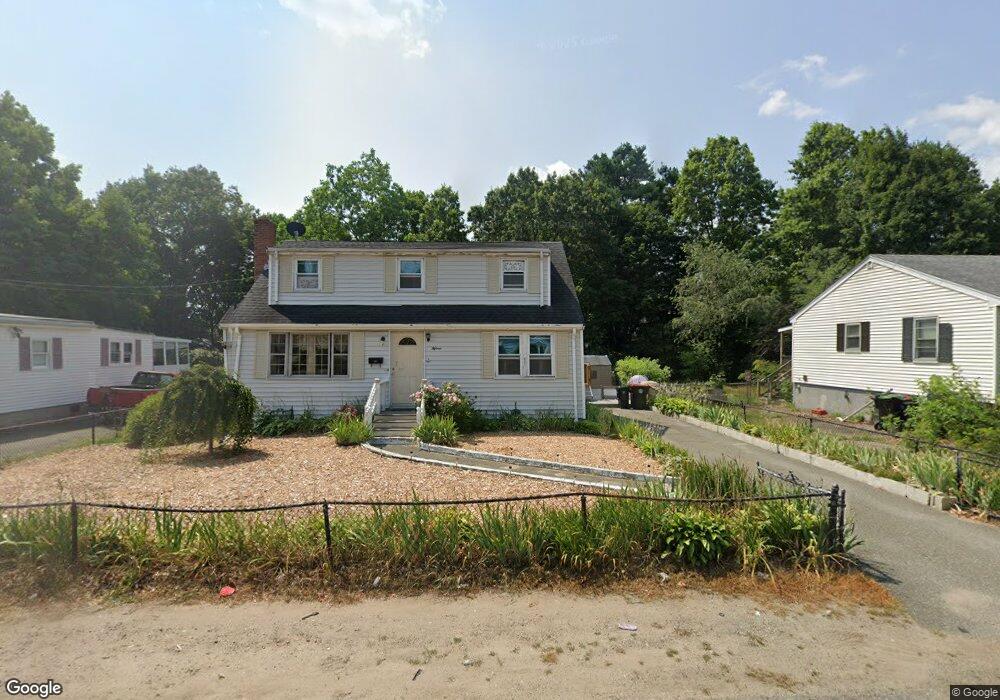
15 Frederick St Brockton, MA 02302
Estimated Value: $374,000 - $496,000
4
Beds
1
Bath
1,344
Sq Ft
$335/Sq Ft
Est. Value
About This Home
This home is located at 15 Frederick St, Brockton, MA 02302 and is currently estimated at $450,447, approximately $335 per square foot. 15 Frederick St is a home located in Plymouth County with nearby schools including Brookfield Elementary School, Downey Elementary School, and Mary E. Baker Elementary School.
Ownership History
Date
Name
Owned For
Owner Type
Purchase Details
Closed on
Oct 16, 2009
Sold by
Monteiro Candida
Bought by
Maina David W and Maina Hellen N
Current Estimated Value
Home Financials for this Owner
Home Financials are based on the most recent Mortgage that was taken out on this home.
Original Mortgage
$147,283
Outstanding Balance
$96,468
Interest Rate
5.14%
Mortgage Type
Purchase Money Mortgage
Estimated Equity
$353,979
Purchase Details
Closed on
Oct 28, 2005
Sold by
Mcdonald Lt
Bought by
Monteiro Candida M
Home Financials for this Owner
Home Financials are based on the most recent Mortgage that was taken out on this home.
Original Mortgage
$206,250
Interest Rate
5.79%
Mortgage Type
Purchase Money Mortgage
Create a Home Valuation Report for This Property
The Home Valuation Report is an in-depth analysis detailing your home's value as well as a comparison with similar homes in the area
Purchase History
| Date | Buyer | Sale Price | Title Company |
|---|---|---|---|
| Maina David W | $150,000 | -- | |
| Monteiro Candida M | $275,000 | -- |
Source: Public Records
Mortgage History
| Date | Status | Borrower | Loan Amount |
|---|---|---|---|
| Open | Monteiro Candida M | $147,283 | |
| Previous Owner | Monteiro Candida M | $206,250 | |
| Previous Owner | Monteiro Candida M | $68,750 |
Source: Public Records
Tax History
| Year | Tax Paid | Tax Assessment Tax Assessment Total Assessment is a certain percentage of the fair market value that is determined by local assessors to be the total taxable value of land and additions on the property. | Land | Improvement |
|---|---|---|---|---|
| 2025 | $5,238 | $432,500 | $140,200 | $292,300 |
| 2024 | $4,999 | $415,900 | $140,200 | $275,700 |
| 2023 | $4,681 | $360,600 | $104,700 | $255,900 |
| 2022 | $4,572 | $327,300 | $95,200 | $232,100 |
| 2021 | $4,275 | $294,800 | $79,100 | $215,700 |
| 2020 | $4,183 | $276,100 | $74,000 | $202,100 |
| 2019 | $4,117 | $264,900 | $72,200 | $192,700 |
| 2018 | $3,877 | $241,400 | $72,200 | $169,200 |
| 2017 | $3,358 | $208,600 | $72,200 | $136,400 |
| 2016 | $2,665 | $153,500 | $70,000 | $83,500 |
| 2015 | $2,343 | $129,100 | $70,000 | $59,100 |
| 2014 | $2,230 | $123,000 | $70,000 | $53,000 |
Source: Public Records
Map
Nearby Homes
Your Personal Tour Guide
Ask me questions while you tour the home.