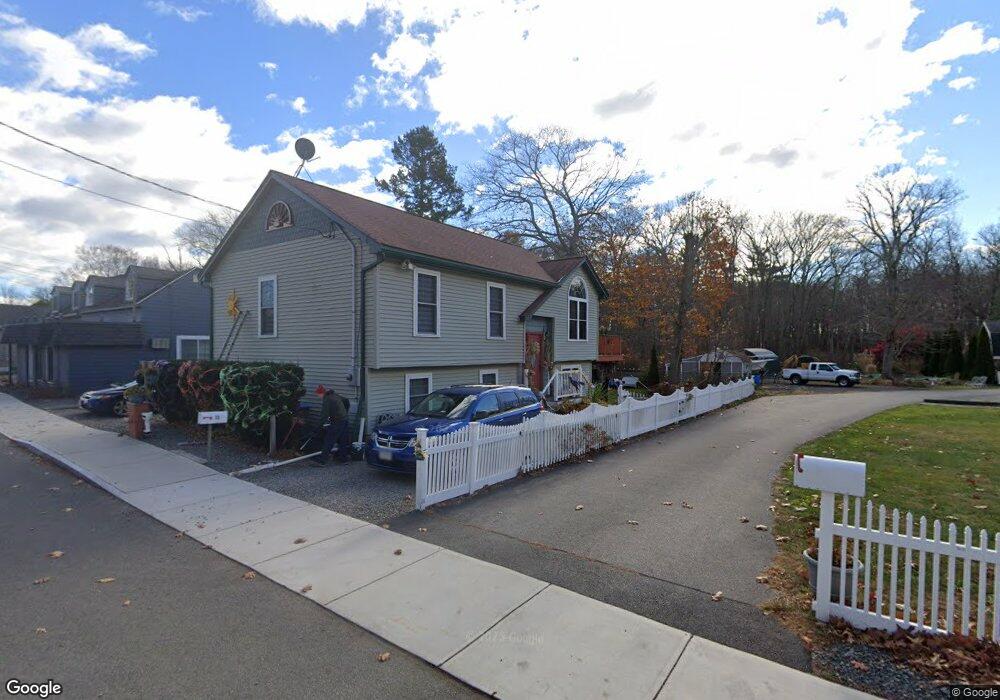
15 Garfield St Salisbury, MA 01952
Estimated Value: $605,000 - $744,000
About This Home
This home is located at 15 Garfield St, Salisbury, MA 01952 and is currently estimated at $652,430, approximately $409 per square foot. 15 Garfield St is a home located in Essex County with nearby schools including Triton Regional High School and River Valley Charter School.
Ownership History
We collect this data history from publicly available records. To have your information removed, we recommend requesting removal directly through your county’s website.
Purchase Details
Purchase Details
Purchase Details
Home Values in the Area
Average Home Value in this Area
Purchase History
We collect this data history from publicly available records. To have your information removed, we recommend requesting removal directly through your county’s website.
| Date | Buyer | Sale Price | Title Company |
|---|---|---|---|
| -- | -- | ||
| $102,000 | -- | ||
| $49,000 | -- |
Mortgage History
We collect this data history from publicly available records. To have your information removed, we recommend requesting removal directly through your county’s website.
| Date | Status | Borrower | Loan Amount |
|---|---|---|---|
| Previous Owner | $88,000 | ||
| Previous Owner | $74,400 | ||
| Previous Owner | $64,000 | ||
| Previous Owner | $52,000 |
Tax History
We collect this data history from publicly available records. To have your information removed, we recommend requesting removal directly through your county’s website.
| Year | Tax Paid | Tax Assessment Tax Assessment Total Assessment is a certain percentage of the fair market value that is determined by local assessors to be the total taxable value of land and additions on the property. | Land | Improvement |
|---|---|---|---|---|
| 2025 | $5,270 | $522,800 | $158,800 | $364,000 |
| 2024 | $4,938 | $472,500 | $158,800 | $313,700 |
| 2023 | $4,686 | $433,900 | $158,800 | $275,100 |
| 2022 | $4,513 | $405,100 | $142,900 | $262,200 |
| 2021 | $4,243 | $376,800 | $142,900 | $233,900 |
| 2020 | $3,918 | $341,900 | $142,900 | $199,000 |
| 2019 | $3,715 | $313,200 | $139,000 | $174,200 |
| 2018 | $3,335 | $283,100 | $108,900 | $174,200 |
| 2017 | $3,347 | $280,800 | $105,000 | $175,800 |
| 2016 | $3,307 | $283,400 | $115,100 | $168,300 |
| 2015 | $3,121 | $265,600 | $107,200 | $158,400 |
Map
- 138 Beach Rd
- 126 Beach Rd
- 135 Beach Rd Unit E1
- 2 Old County Rd Unit 12
- 2 Old County Rd Unit 9
- 2 Old County Rd Unit 6
- 2 Old County Rd Unit 19
- 2 Old County Rd Unit 10
- 2 Old County Rd Unit 16
- 2 Old County Rd Unit 7
- 2 Old County Rd Unit 15
- 2 Old County Rd Unit 14
- 12 Old County Rd
- 170 Beach Rd Unit 36
- 188 Beach Rd Unit 16
- 2 Starfish Way Unit B
- 233 Beach Rd Unit A11
- 233 Beach Rd Unit A10
- 233 Beach Rd Unit A1
- 34 Cable Ave
Ask me questions while you tour the home.