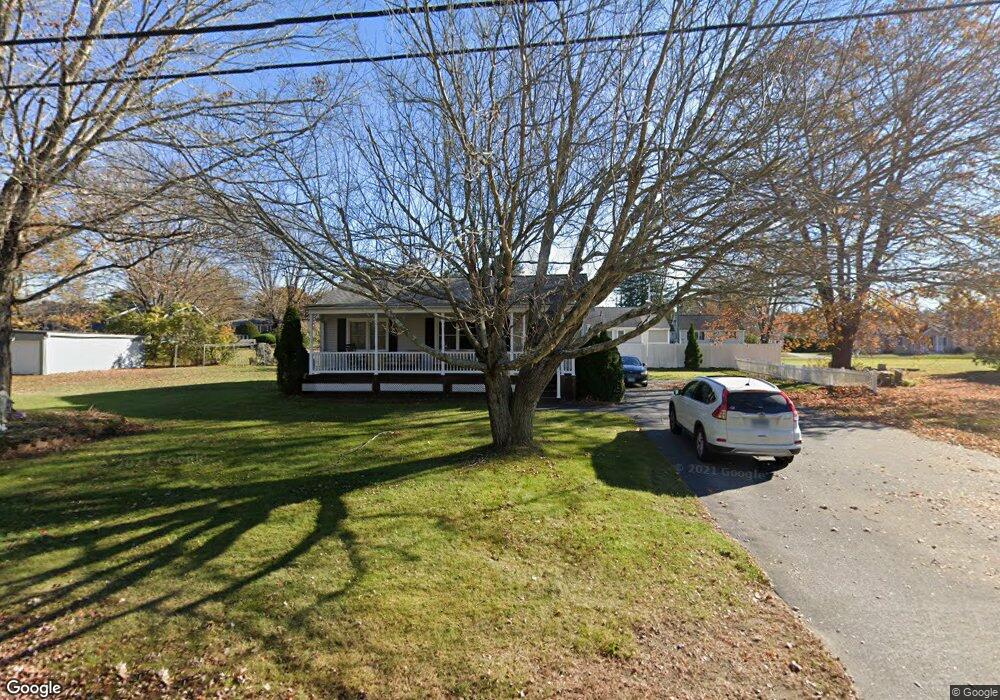
15 Perry St Putnam, CT 06260
Estimated Value: $247,000 - $329,000
4
Beds
2
Baths
936
Sq Ft
$321/Sq Ft
Est. Value
About This Home
This home is located at 15 Perry St, Putnam, CT 06260 and is currently estimated at $300,496, approximately $321 per square foot. 15 Perry St is a home located in Windham County with nearby schools including Putnam Elementary School, Putnam Middle School, and Putnam High School.
Ownership History
Date
Name
Owned For
Owner Type
Purchase Details
Closed on
Jun 18, 2025
Sold by
Durocher Ft and Durocher
Bought by
Durocher Jeffrey A and Zoldak Kayla
Current Estimated Value
Home Financials for this Owner
Home Financials are based on the most recent Mortgage that was taken out on this home.
Original Mortgage
$238,075
Outstanding Balance
$237,464
Interest Rate
6.81%
Mortgage Type
FHA
Estimated Equity
$63,032
Create a Home Valuation Report for This Property
The Home Valuation Report is an in-depth analysis detailing your home's value as well as a comparison with similar homes in the area
Home Values in the Area
Average Home Value in this Area
Purchase History
| Date | Buyer | Sale Price | Title Company |
|---|---|---|---|
| Durocher Jeffrey A | $310,000 | None Available | |
| Durocher Jeffrey A | $310,000 | None Available |
Source: Public Records
Mortgage History
| Date | Status | Borrower | Loan Amount |
|---|---|---|---|
| Open | Durocher Jeffrey A | $238,075 | |
| Closed | Durocher Jeffrey A | $238,075 |
Source: Public Records
Tax History
| Year | Tax Paid | Tax Assessment Tax Assessment Total Assessment is a certain percentage of the fair market value that is determined by local assessors to be the total taxable value of land and additions on the property. | Land | Improvement |
|---|---|---|---|---|
| 2025 | $5,182 | $204,400 | $29,600 | $174,800 |
| 2024 | $6,416 | $193,600 | $29,600 | $164,000 |
| 2023 | $4,158 | $130,800 | $23,500 | $107,300 |
| 2022 | $4,014 | $130,800 | $23,500 | $107,300 |
| 2021 | $3,903 | $130,800 | $23,500 | $107,300 |
| 2020 | $3,903 | $130,800 | $23,500 | $107,300 |
| 2019 | $3,236 | $102,200 | $26,000 | $76,200 |
| 2018 | $3,111 | $102,200 | $26,000 | $76,200 |
| 2017 | $3,005 | $102,200 | $26,000 | $76,200 |
| 2016 | $2,702 | $102,200 | $26,000 | $76,200 |
| 2015 | $2,639 | $102,200 | $26,000 | $76,200 |
| 2014 | $2,849 | $121,400 | $38,600 | $82,800 |
Source: Public Records
Map
Nearby Homes
- 132 Grove St
- 74 Perry St Unit 183
- 83 Perry St Unit 167
- 86 Perry St Unit 277
- 69 Perry St Unit 130
- 24 Tatem St
- 77 Chapman St
- 115 Grove St
- 25 Seward St
- 17 Vine St
- 29 Bellevue St
- 6 Prospect St
- 2 Lyon St Unit 12
- 70 Walnut St
- 203 School St
- 19 Bolles St
- 347-349 Kennedy Dr
- 13 Mohegan St
- 224 Pomfret St
- 23 Mechanics St Unit 101
Your Personal Tour Guide
Ask me questions while you tour the home.