15 Phillips St Quincy, MA 02170
Wollaston NeighborhoodEstimated Value: $804,000 - $878,000
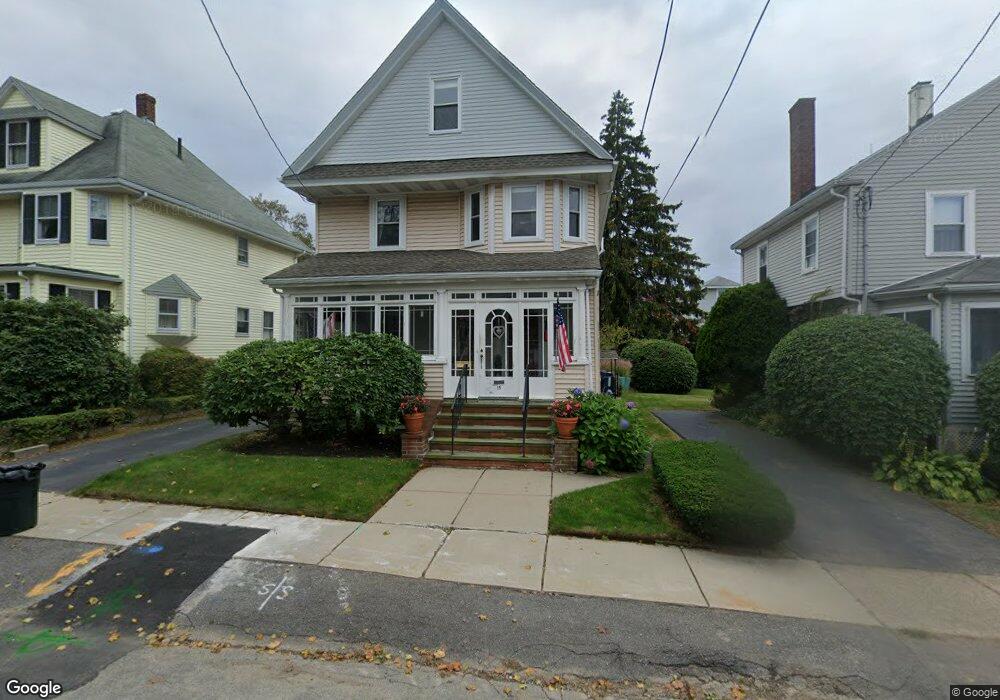
About This Home
This home is located at 15 Phillips St, Quincy, MA 02170 and is currently estimated at $828,234, approximately $495 per square foot. 15 Phillips St is a home located in Norfolk County with nearby schools including Beechwood Knoll Elementary School, Central Middle School, and North Quincy High School.
Ownership History
We collect this data history from publicly available records. To have your information removed, we recommend requesting removal directly through your county’s website.
Purchase Details
Home Values in the Area
Average Home Value in this Area
Purchase History
We collect this data history from publicly available records. To have your information removed, we recommend requesting removal directly through your county’s website.
| Date | Buyer | Sale Price | Title Company |
|---|---|---|---|
| $265,000 | -- |
Mortgage History
We collect this data history from publicly available records. To have your information removed, we recommend requesting removal directly through your county’s website.
| Date | Status | Borrower | Loan Amount |
|---|---|---|---|
| Open | $200,000 | ||
| Closed | $193,000 |
Tax History
We collect this data history from publicly available records. To have your information removed, we recommend requesting removal directly through your county’s website.
| Year | Tax Paid | Tax Assessment Tax Assessment Total Assessment is a certain percentage of the fair market value that is determined by local assessors to be the total taxable value of land and additions on the property. | Land | Improvement |
|---|---|---|---|---|
| 2025 | $7,855 | $681,300 | $325,000 | $356,300 |
| 2024 | $7,577 | $672,300 | $325,000 | $347,300 |
| 2023 | $7,040 | $632,500 | $309,500 | $323,000 |
| 2022 | $6,607 | $551,500 | $247,600 | $303,900 |
| 2021 | $6,560 | $540,400 | $247,600 | $292,800 |
| 2020 | $6,416 | $516,200 | $247,600 | $268,600 |
| 2019 | $6,118 | $487,500 | $231,400 | $256,100 |
| 2018 | $5,963 | $447,000 | $210,400 | $236,600 |
| 2017 | $6,065 | $428,000 | $210,400 | $217,600 |
| 2016 | $5,658 | $394,000 | $191,300 | $202,700 |
| 2015 | $5,176 | $354,500 | $173,900 | $180,600 |
| 2014 | $4,947 | $332,900 | $165,600 | $167,300 |
Map
- 80 Willet St
- 53 Ellington Rd
- 113 Elm Ave
- 99 Phillips St
- 40 Woodbine St
- 41 Buckingham Rd
- 174 Beach St
- 10 Weston Ave Unit 112
- 72 Freeman St
- 13 Wentworth Rd Unit 303
- 251 Newport Ave
- 245 Newport Ave
- 24 Rawson Rd
- 118 E Elm Ave
- 120 Holmes St Unit 304
- 35 Sewall St
- 267-269 Farrington St
- 153 Vassall St
- 93 Sachem St
- 72 French St
- 14 Phillips St
- 14 Phillips St Unit 1
- 10 Phillips St
- 6 Phillips St
- 20 Phillips St
- 20 Phillips St Unit 1
- 13 Willow St
- 9 Willow St
- 51 Willet St
- 15 Willow St
- 4 Phillips St
- 26 Phillips St
- 17 Phillips St
- 9 Phillips St
- 5 Willow St
- 19 Phillips St
- 19 Phillips St Unit 1
- 5 Phillips St
- 19-21 Phillips St
- 21 Willow St
Ask me questions while you tour the home.