15 Pine St Rehoboth, MA 02769
Estimated Value: $654,770 - $936,000
About This Home
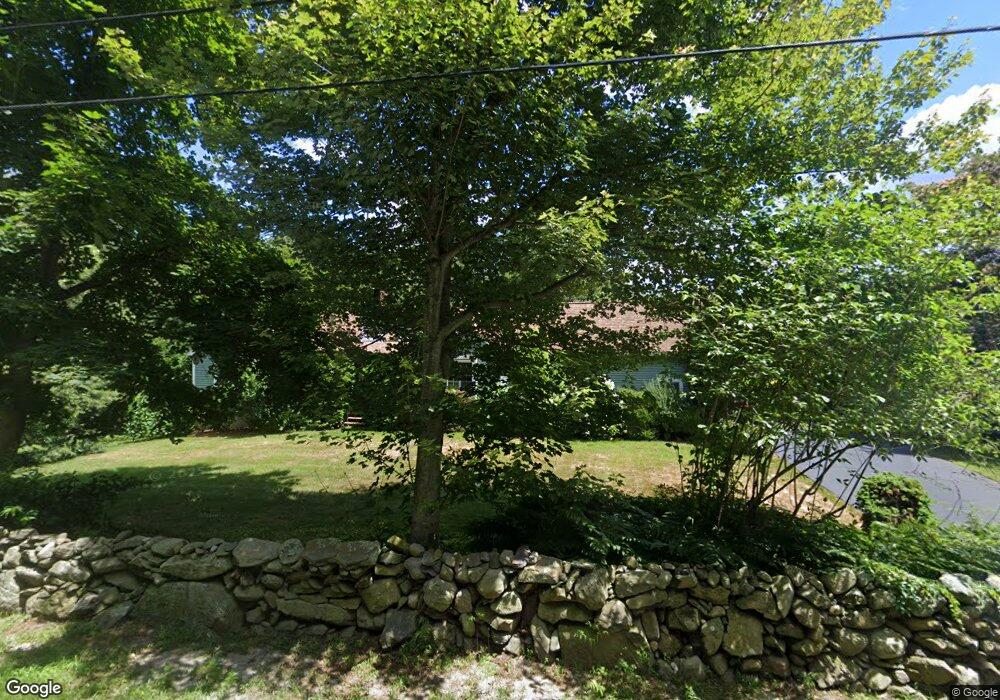
This home is located at 15 Pine St, Rehoboth, MA 02769 and is currently estimated at $742,443, approximately $359 per square foot. 15 Pine St is a home located in Bristol County with nearby schools including Dighton-Rehoboth Regional High School, St Cecilia School, and St Margaret School.
Ownership History
We collect this data history from publicly available records. To have your information removed, we recommend requesting removal directly through your county’s website.
Purchase Details
Purchase Details
Home Values in the Area
Average Home Value in this Area
Purchase History
We collect this data history from publicly available records. To have your information removed, we recommend requesting removal directly through your county’s website.
| Date | Buyer | Sale Price | Title Company |
|---|---|---|---|
| $229,500 | -- | ||
| $209,900 | -- |
Mortgage History
We collect this data history from publicly available records. To have your information removed, we recommend requesting removal directly through your county’s website.
| Date | Status | Borrower | Loan Amount |
|---|---|---|---|
| Open | $200,000 | ||
| Closed | $206,550 | ||
| Previous Owner | $157,300 | ||
| Previous Owner | $15,504 |
Tax History
We collect this data history from publicly available records. To have your information removed, we recommend requesting removal directly through your county’s website.
| Year | Tax Paid | Tax Assessment Tax Assessment Total Assessment is a certain percentage of the fair market value that is determined by local assessors to be the total taxable value of land and additions on the property. | Land | Improvement |
|---|---|---|---|---|
| 2025 | $63 | $564,700 | $191,500 | $373,200 |
| 2024 | $6,246 | $549,800 | $191,500 | $358,300 |
| 2023 | $6,115 | $528,100 | $187,500 | $340,600 |
| 2022 | $5,927 | $467,800 | $179,100 | $288,700 |
| 2021 | $4,465 | $426,500 | $162,800 | $263,700 |
| 2020 | $5,374 | $409,600 | $162,800 | $246,800 |
| 2018 | $2,298 | $401,800 | $155,000 | $246,800 |
| 2017 | $4,406 | $350,800 | $155,000 | $195,800 |
| 2016 | $4,335 | $356,800 | $155,000 | $201,800 |
| 2015 | $4,093 | $332,500 | $147,800 | $184,700 |
| 2014 | $3,996 | $321,200 | $140,600 | $180,600 |
Map
- 39 Letendre Rd
- 191 Fairway Dr
- 84 Pine St
- 2 Rod Way
- 9 Gerry Dr
- 360 Woodland Ave
- 390 Read St
- 50 Meadowlark Dr
- 170 Rocky Hill Rd
- 156 Rocky Hill Rd
- 0 Woodland Ave
- 545 Tremont St
- 67 Coleman St
- 241 Perryville Rd
- 160 Willis Ave
- 144 Burnside Ave
- 917 Newman Ave
- 67 Cherry Hill Dr
- 1063 Newman Ave
- 224 Perryville Rd
Ask me questions while you tour the home.