T
Seller's Agent in 2026
Tom Noonan
Allied Real Estate
(207) 838-7851
20 in this area
78 Total Sales
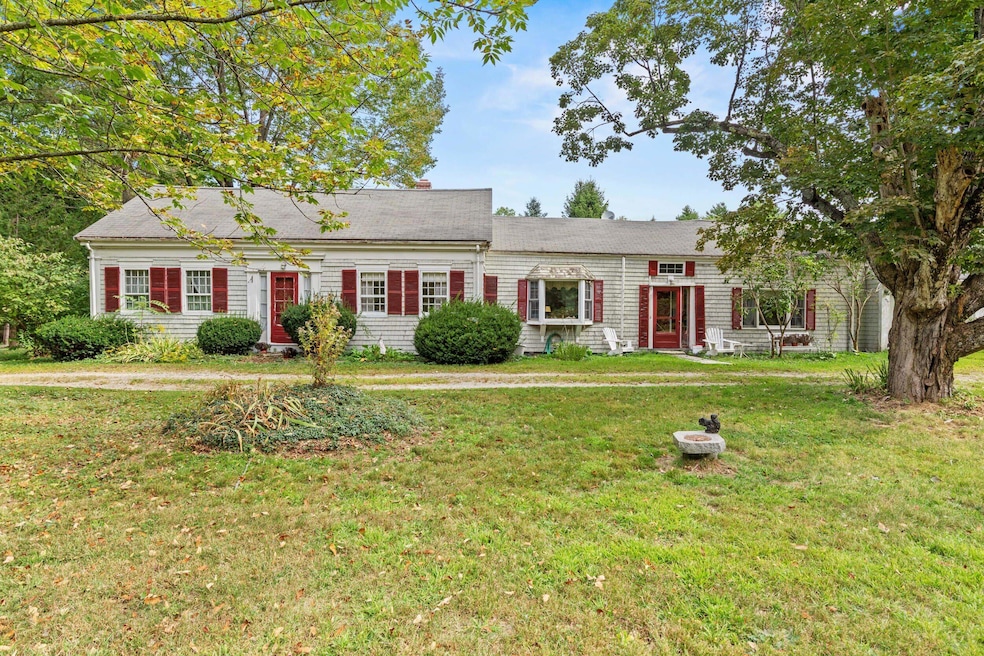
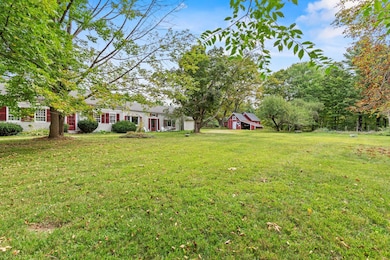
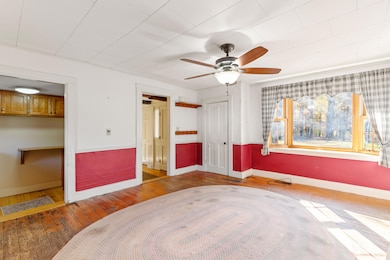
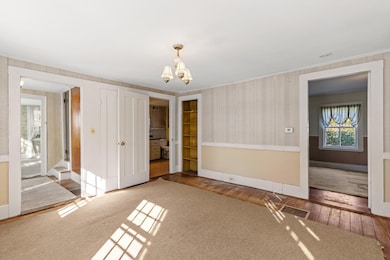
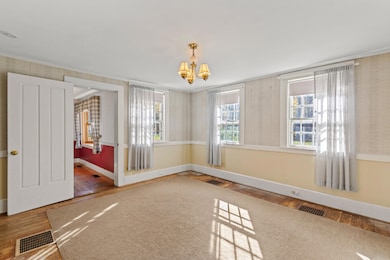
1840's home with lots of charm. Level lot with lots of fruit trees. Detached shed/barn.Property taxes should be lower because the bill reflects the larger land parcel. This home is a diamond in the rough. investing your elbow grease here should pay dividends.
| Date | Type | Sale Price | Title Company |
|---|---|---|---|
| Quit Claim Deed | $345,000 | -- | |
| Warranty Deed | -- | None Available | |
| Warranty Deed | -- | None Available | |
| Warranty Deed | -- | None Available | |
| Warranty Deed | -- | None Available | |
| Warranty Deed | $400,000 | None Available | |
| Warranty Deed | $400,000 | None Available | |
| Quit Claim Deed | -- | None Available | |
| Quit Claim Deed | -- | None Available | |
| Interfamily Deed Transfer | -- | -- | |
| Interfamily Deed Transfer | -- | -- | |
| Interfamily Deed Transfer | -- | -- |
| Date | Status | Loan Amount | Loan Type |
|---|---|---|---|
| Open | $276,000 | Purchase Money Mortgage | |
| Previous Owner | $142,000 | Purchase Money Mortgage |
| Date | Event | Price | List to Sale | Price per Sq Ft |
|---|---|---|---|---|
| 02/23/2026 02/23/26 | Sold | $345,000 | -2.8% | $193 / Sq Ft |
| 01/22/2026 01/22/26 | Pending | -- | -- | -- |
| 12/26/2025 12/26/25 | For Sale | $355,000 | 0.0% | $199 / Sq Ft |
| 12/23/2025 12/23/25 | Pending | -- | -- | -- |
| 12/23/2025 12/23/25 | Price Changed | $355,000 | -5.3% | $199 / Sq Ft |
| 11/06/2025 11/06/25 | For Sale | $375,000 | -- | $210 / Sq Ft |
| Year | Tax Paid | Tax Assessment Tax Assessment Total Assessment is a certain percentage of the fair market value that is determined by local assessors to be the total taxable value of land and additions on the property. | Land | Improvement |
|---|---|---|---|---|
| 2025 | $5,935 | $492,100 | $202,200 | $289,900 |
| 2024 | $5,644 | $492,100 | $202,200 | $289,900 |
| 2023 | $5,204 | $464,600 | $188,100 | $276,500 |
| 2022 | $4,795 | $413,000 | $167,300 | $245,700 |
| 2021 | $3,988 | $341,500 | $145,600 | $195,900 |
| 2020 | $3,948 | $288,200 | $120,400 | $167,800 |
| 2019 | $4,219 | $288,200 | $120,400 | $167,800 |
| 2018 | $3,912 | $257,700 | $108,300 | $149,400 |
| 2017 | $3,601 | $219,200 | $96,600 | $122,600 |
| 2016 | $3,441 | $219,200 | $96,600 | $122,600 |
| 2015 | $3,321 | $219,200 | $96,600 | $122,600 |
| 2014 | $3,069 | $219,200 | $96,600 | $122,600 |
| 2013 | -- | $219,200 | $96,600 | $122,600 |
T
Seller's Agent in 2026
Tom Noonan
Allied Real Estate
(207) 838-7851
20 in this area
78 Total Sales

Buyer's Agent in 2026
Craig Garrett
Tim Dunham Realty
(207) 544-4432
3 in this area
64 Total Sales
Source: Maine Listings
MLS Number: 1642927
APN: WINM-000006-000000-000033
Disclaimer: Certain information contained herein is derived from information provided by parties other than Homes.com. All information provided is deemed reliable, but is not guaranteed to be accurate and should be independently verified.
![]() Listing data is derived in whole or in part from Maine Real Estate Information System, Inc. (d/b/a Maine Listings) and is for consumers' personal, noncommercial use only. Dimensions are approximate and not guaranteed. All data should be independently verified.
Listing data is derived in whole or in part from Maine Real Estate Information System, Inc. (d/b/a Maine Listings) and is for consumers' personal, noncommercial use only. Dimensions are approximate and not guaranteed. All data should be independently verified.
© 2026 Maine Real Estate Information System, Inc. All Rights Reserved. Equal Housing Opportunity.
Homes.com, LLC, 17600 Laguna Canyon Rd Irvine, CA 92618 (888)-952-6393
![]()
Ask me questions while you tour the home.